Benchmark QA
Note
Projects with Benchmark Quality Assurance are only available to select customers. Please reach out to [email protected] to learn more and get access to this feature!
Benchmark Quality Assurance (BMQA) uses an already existing Manual QA project as a 'benchmark' to automatically review labels created by annotators. The Manual QA 'benchmark project' needs to be complete, and use the same ontology as the Benchmark QA project you are creating.
Creating benchmark QA projects
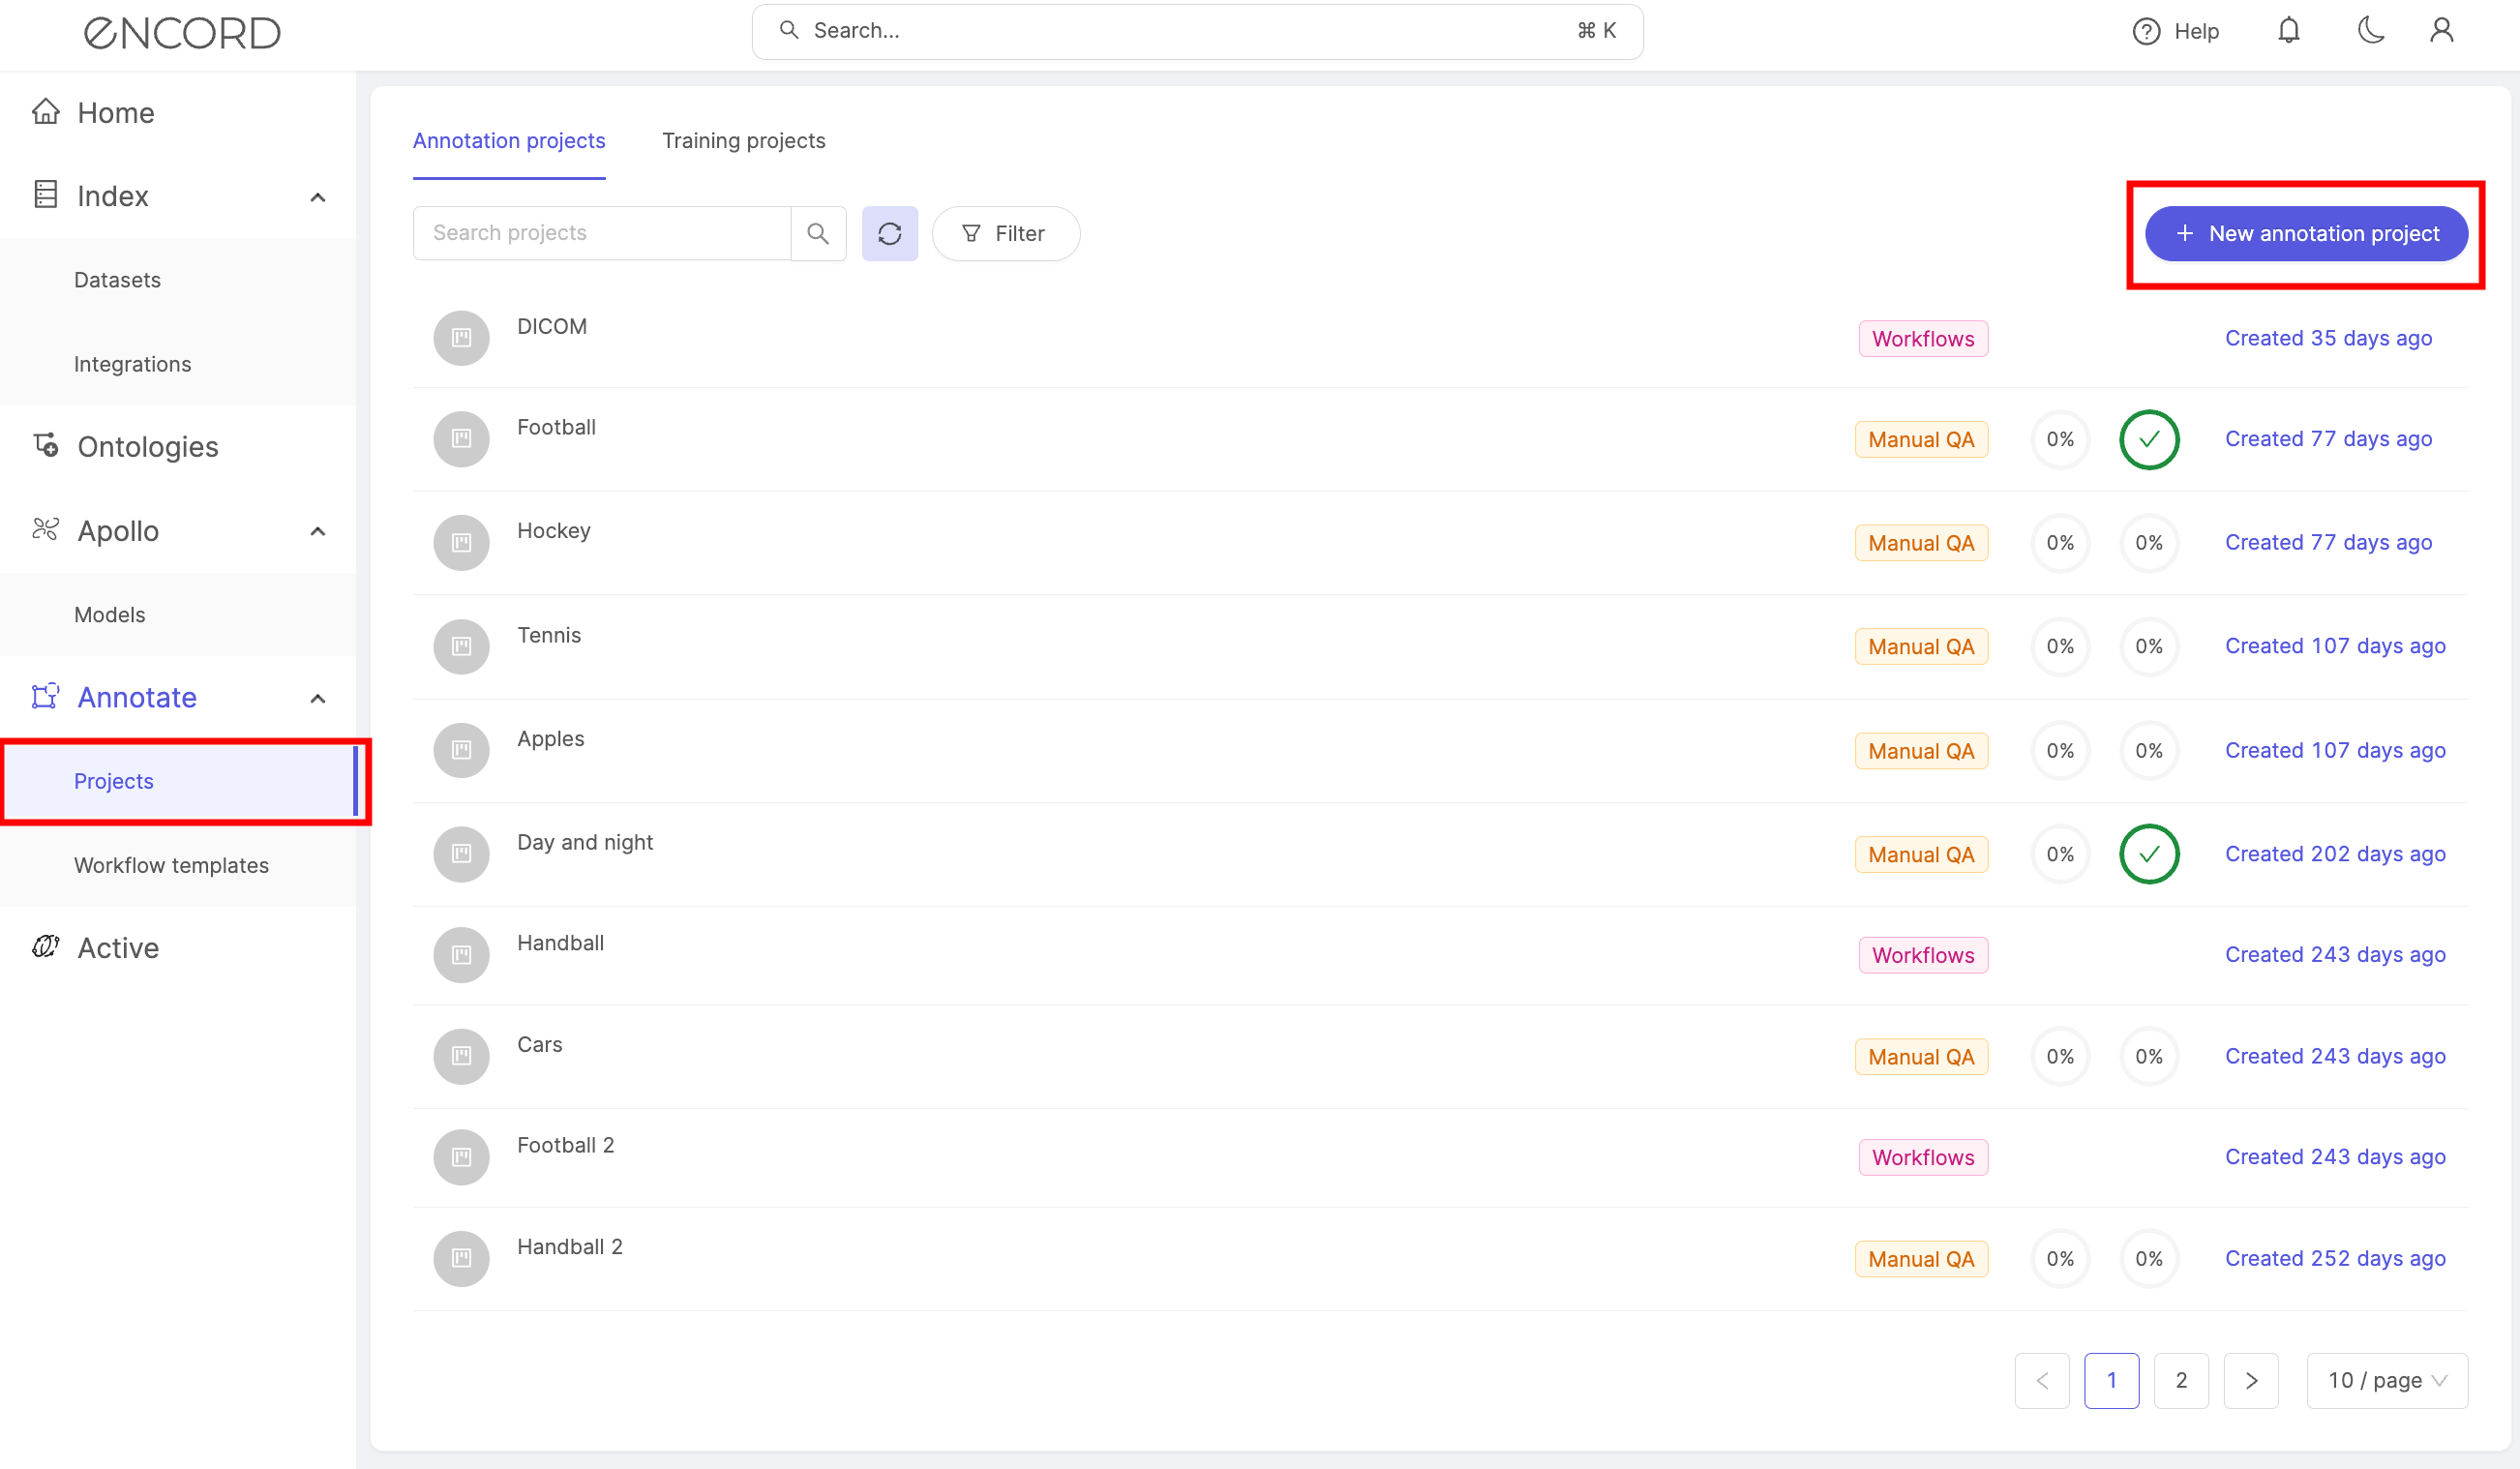
In the 'Annotate' section of the navigation bar, select 'Annotation projects'. Click the + New annotation project button to create a new project.
1. Enter details
In the 'Enter details' screen, enter a project title and optional description. A clear title and description help keep your projects organized.
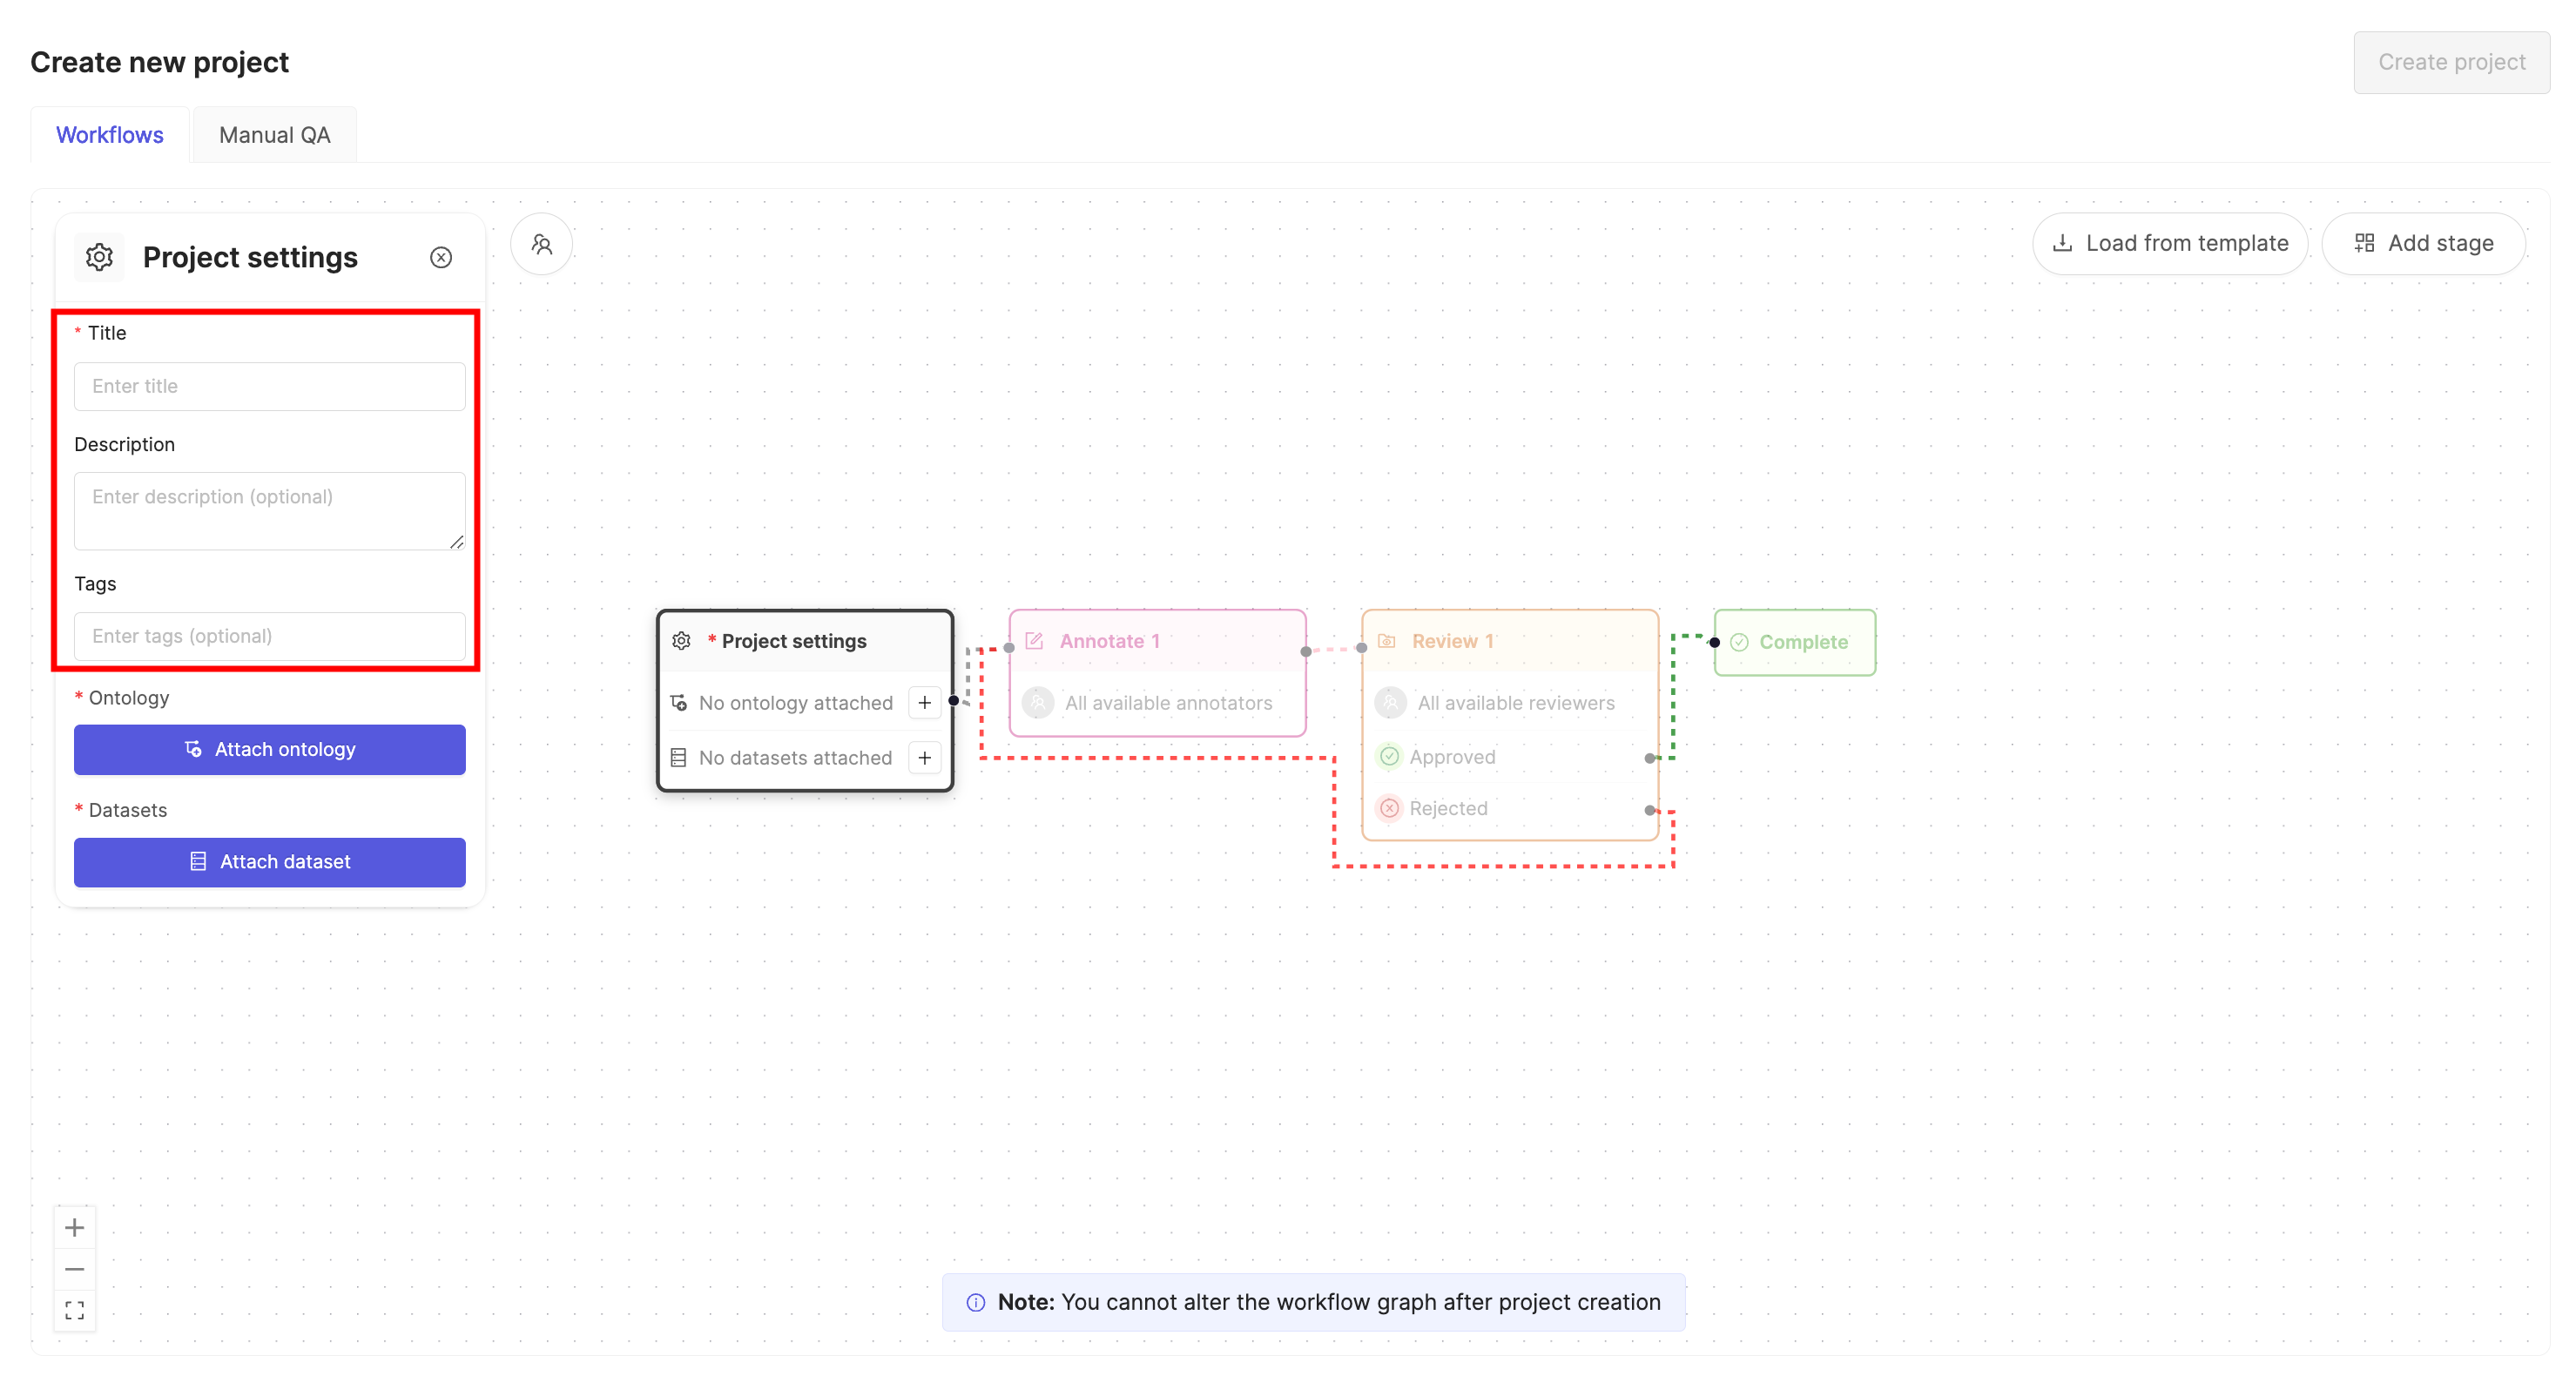
If you part of an organization, you will see an optional project tags drop-down. Project tags are useful for categorizing your projects. Select as many tags as are relevant to your project.
When you're ready to continue setting up your project, click Next.
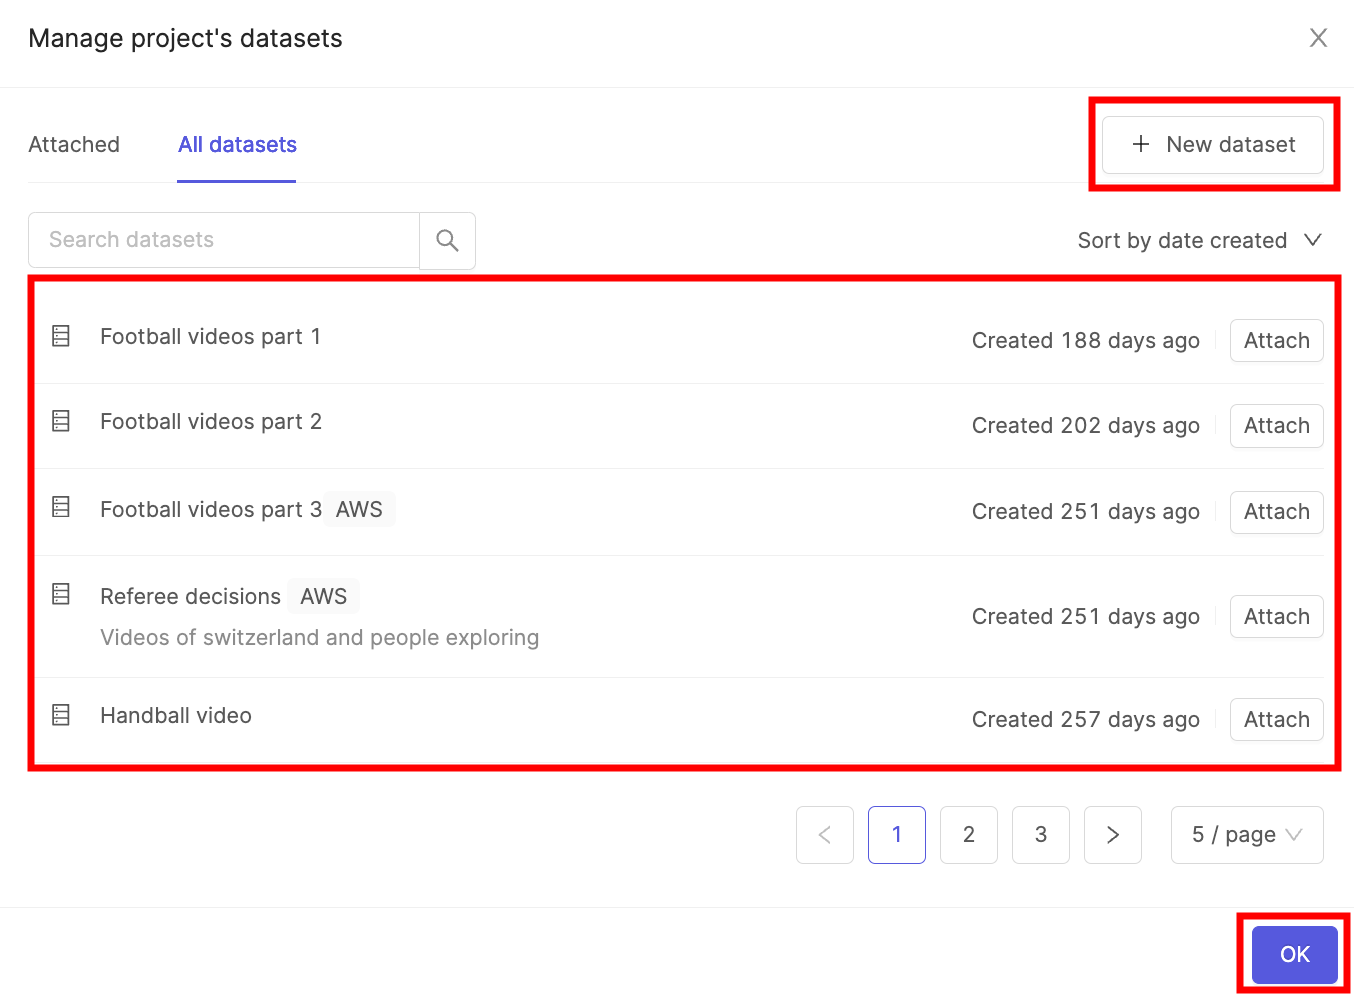
2. Add datasets
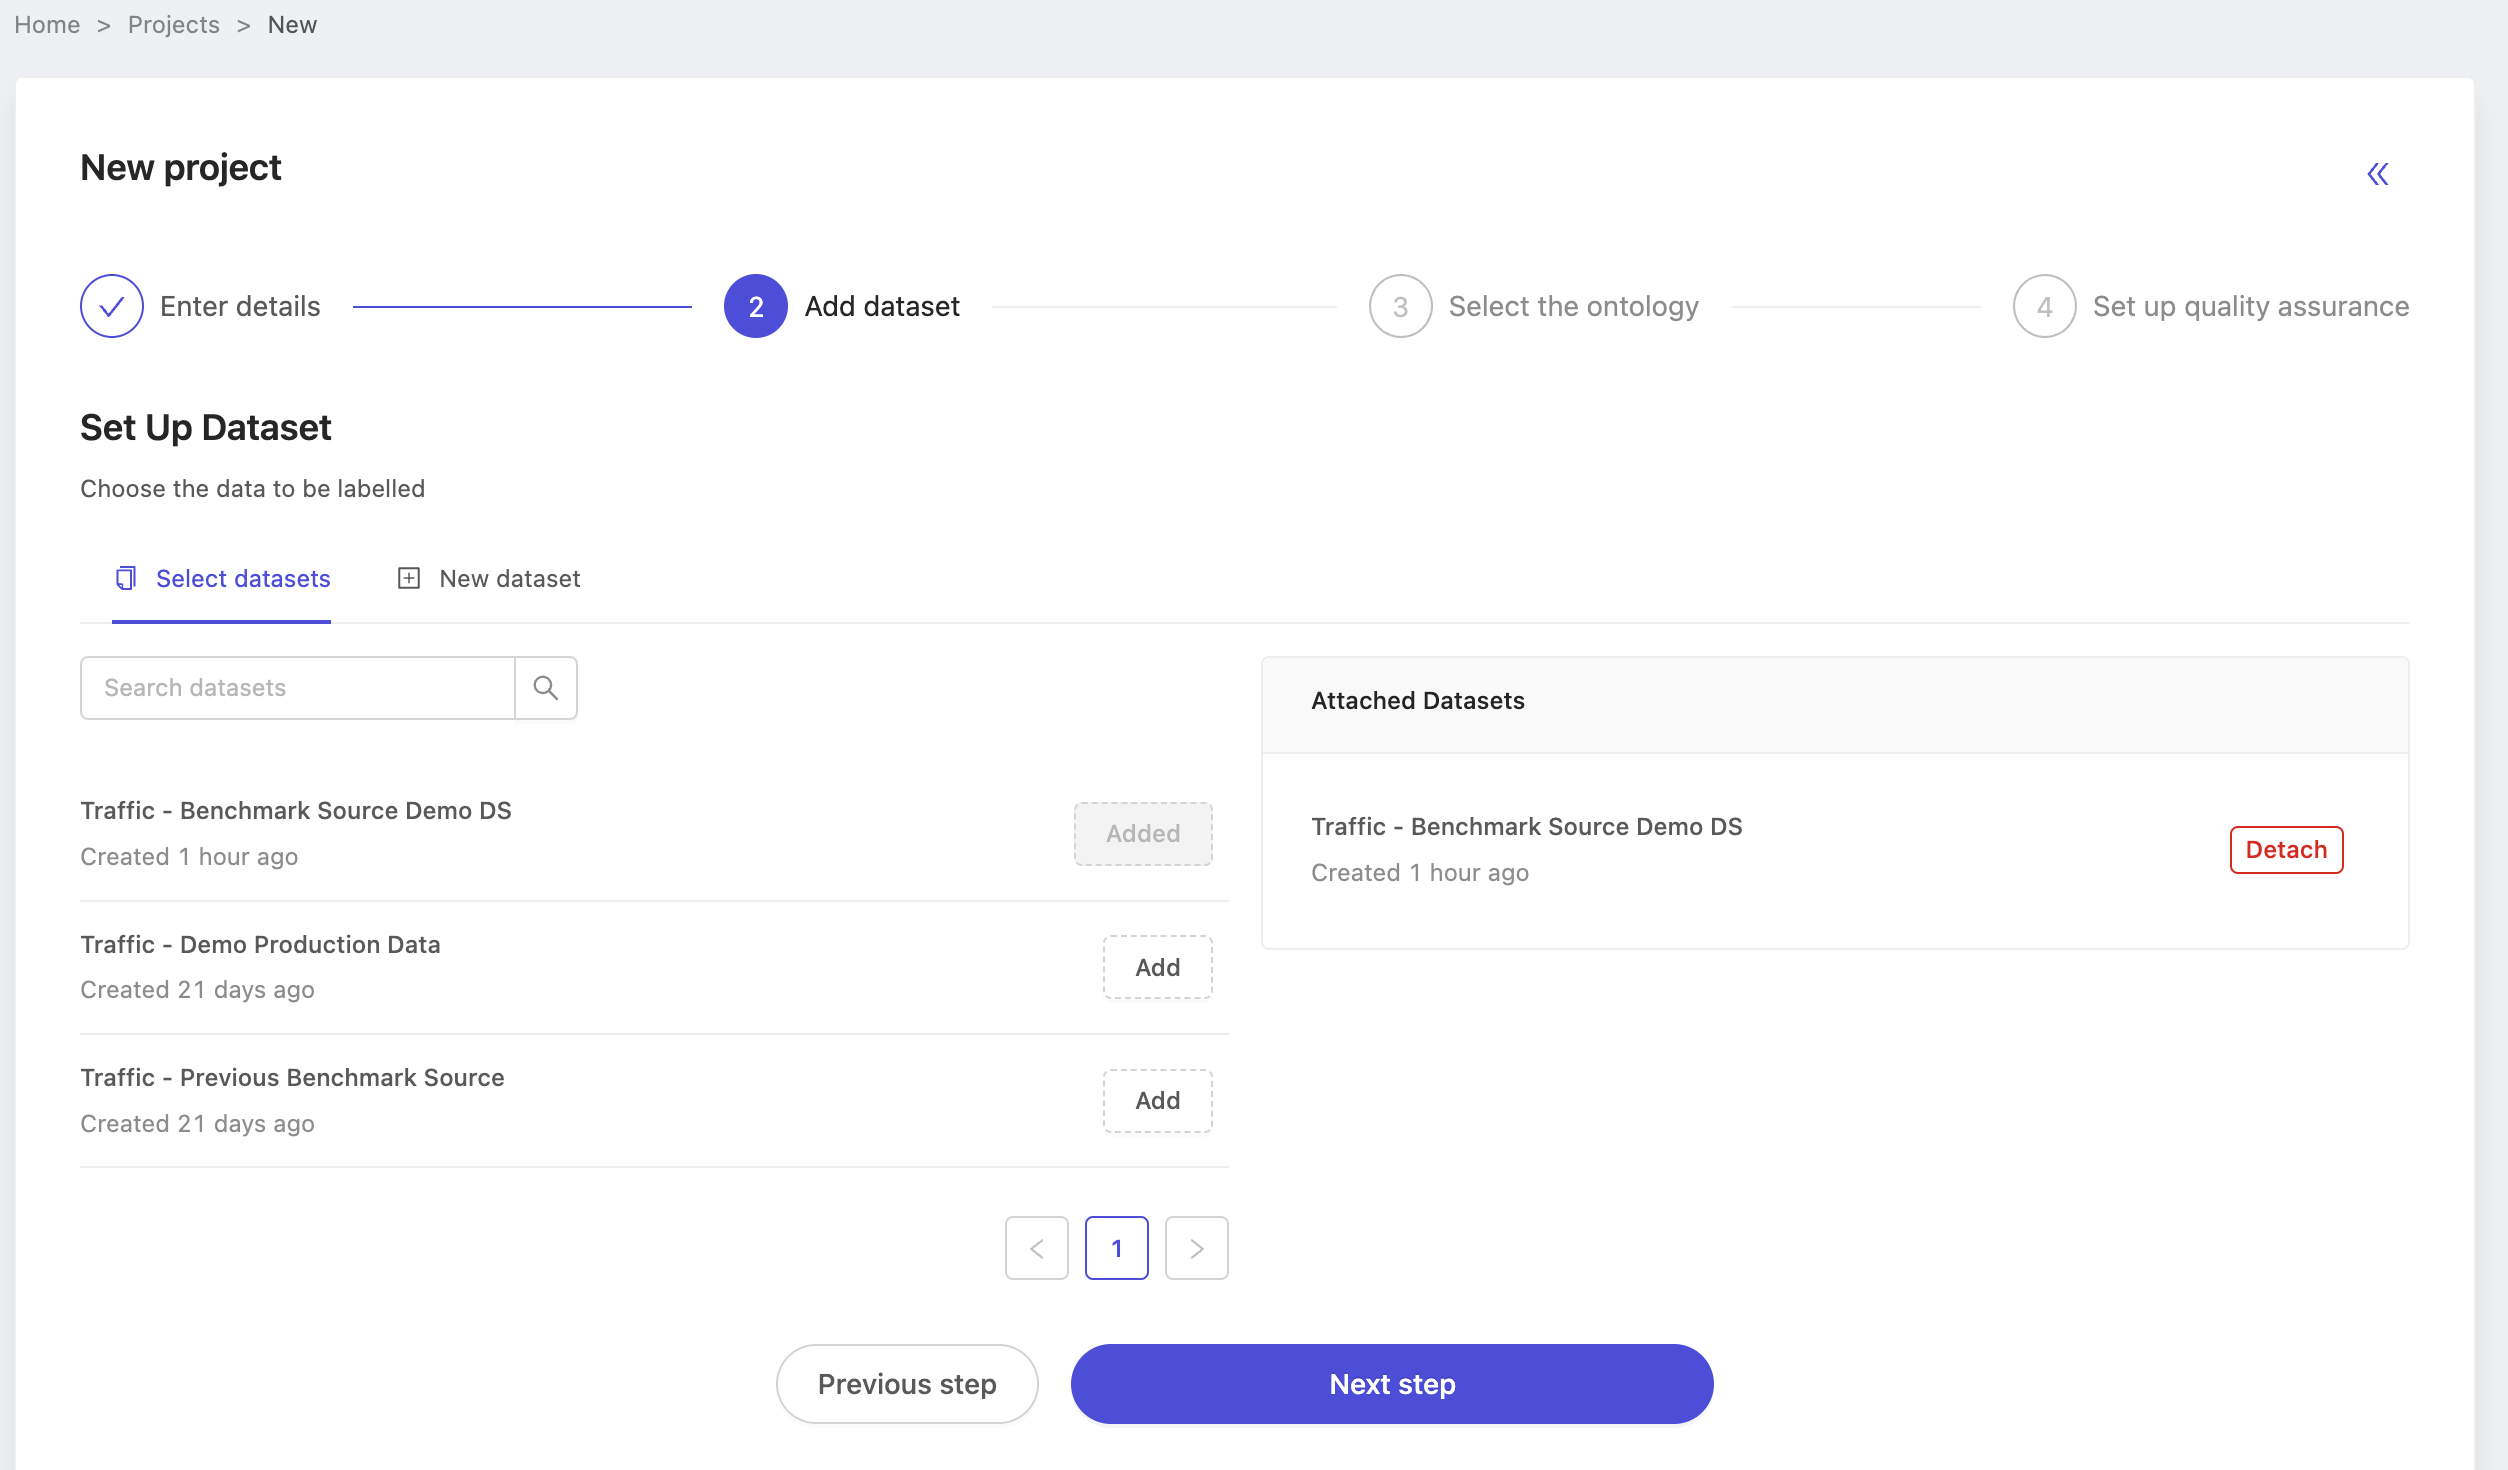
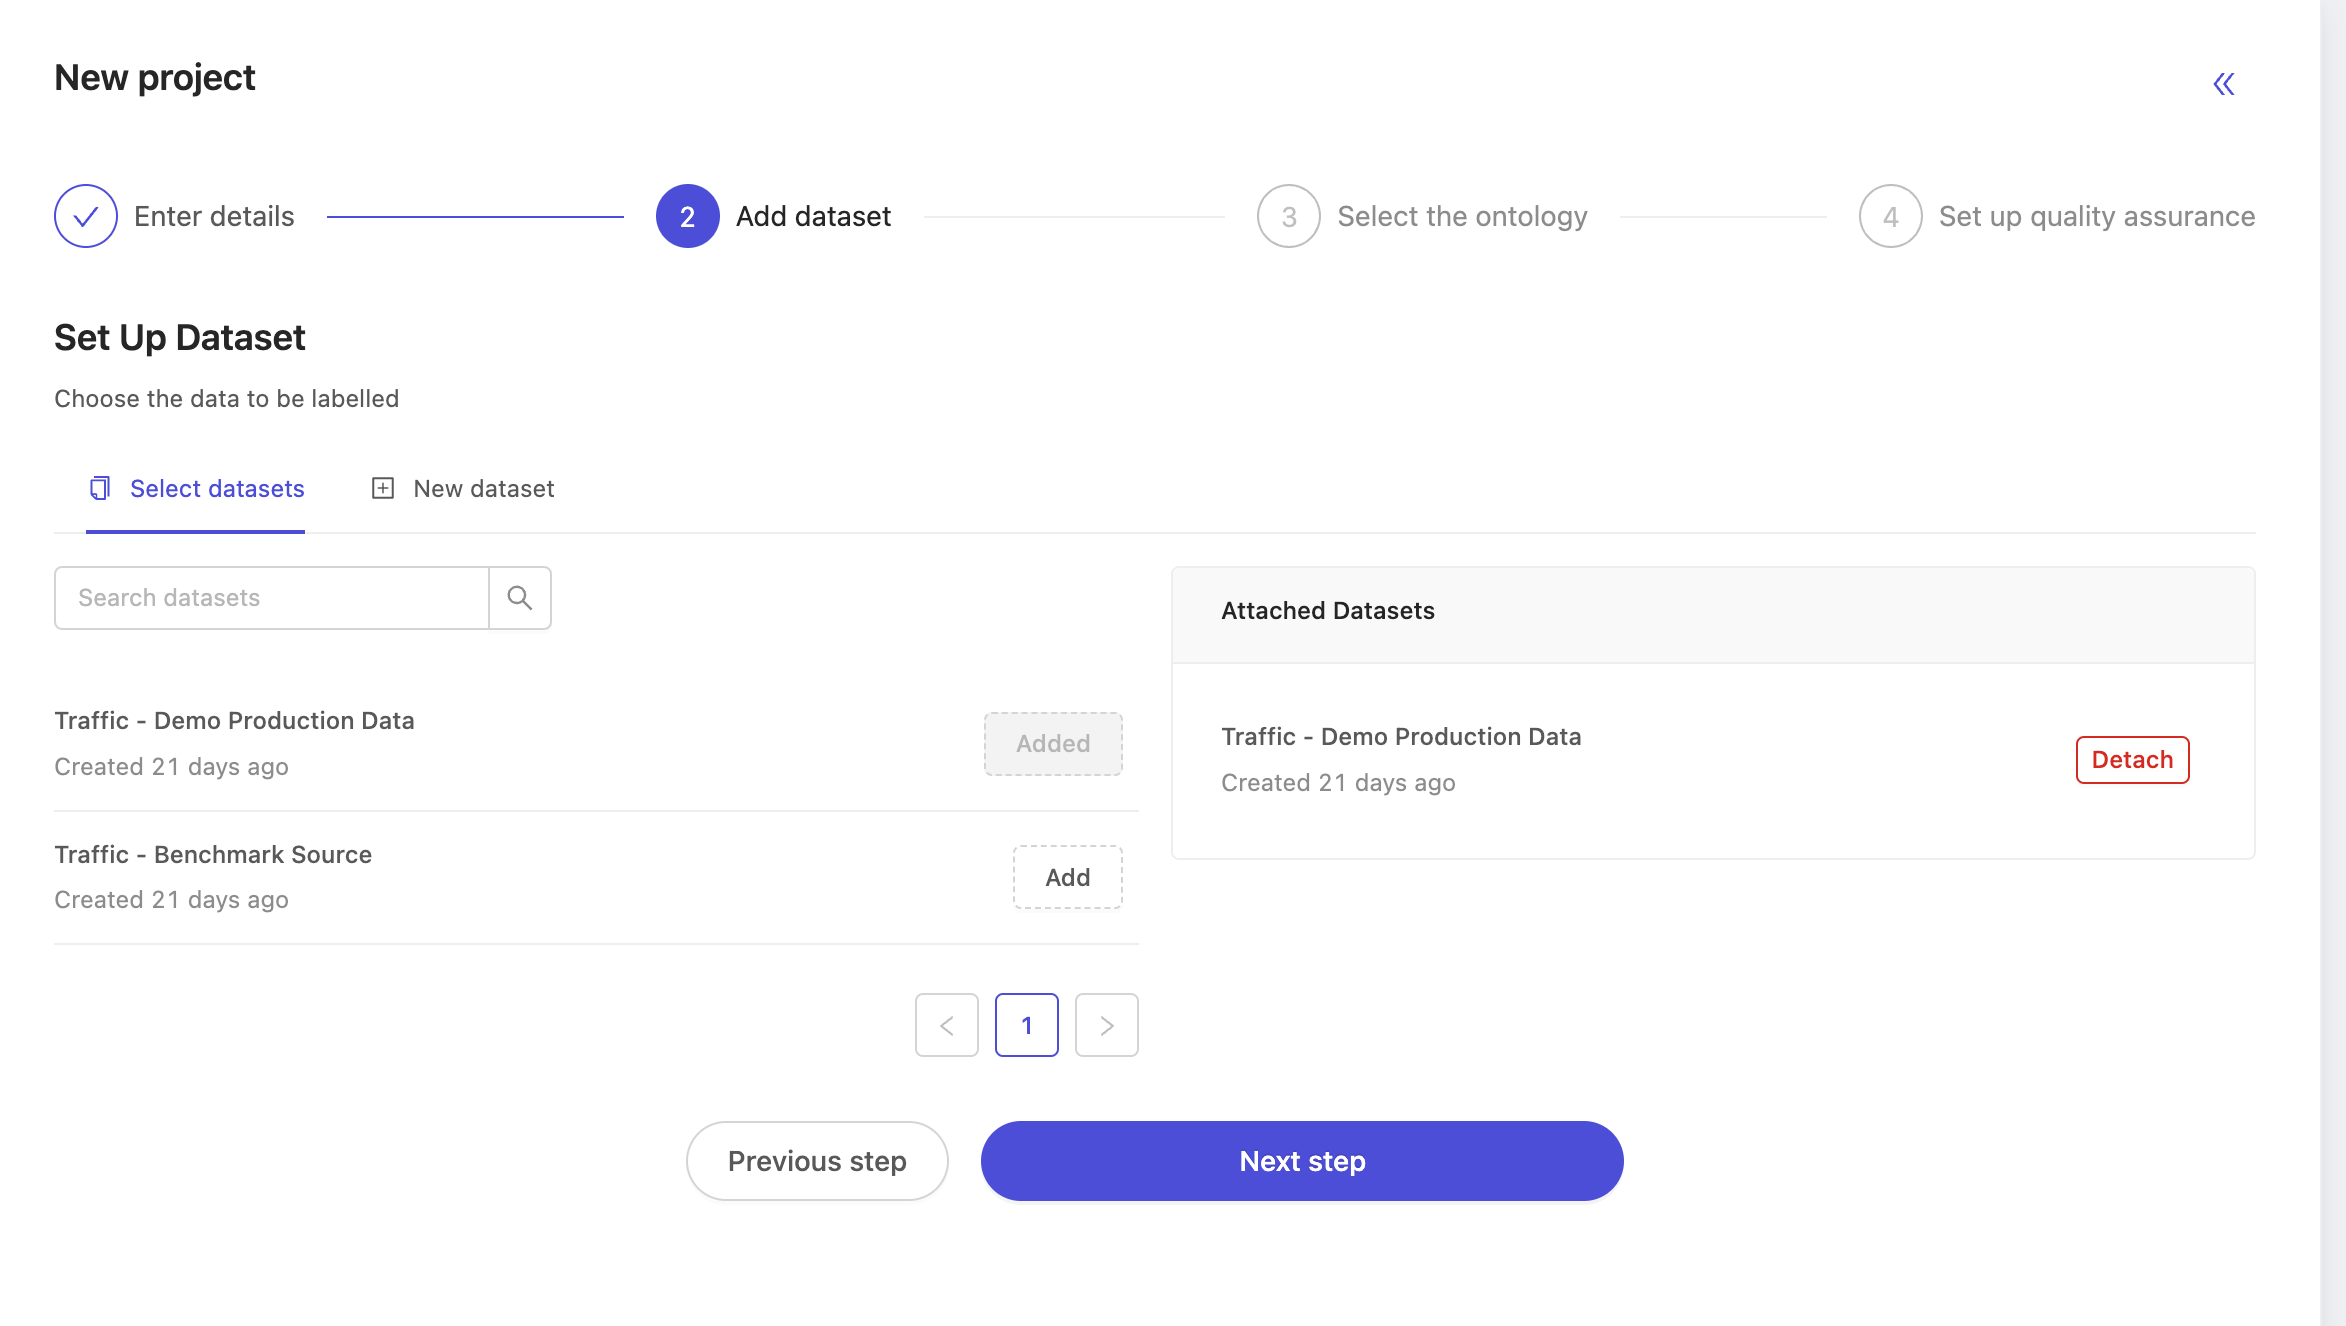
The 'Add datasets' screen is where you attach datasets to your project. You can select from a list of datasets you have already created by clicking Add next to a dataset, or create a new dataset by clicking the + New dataset tab to initiate the dataset creation flow. Attached datasets appear in a list on the right.
3. Select ontology
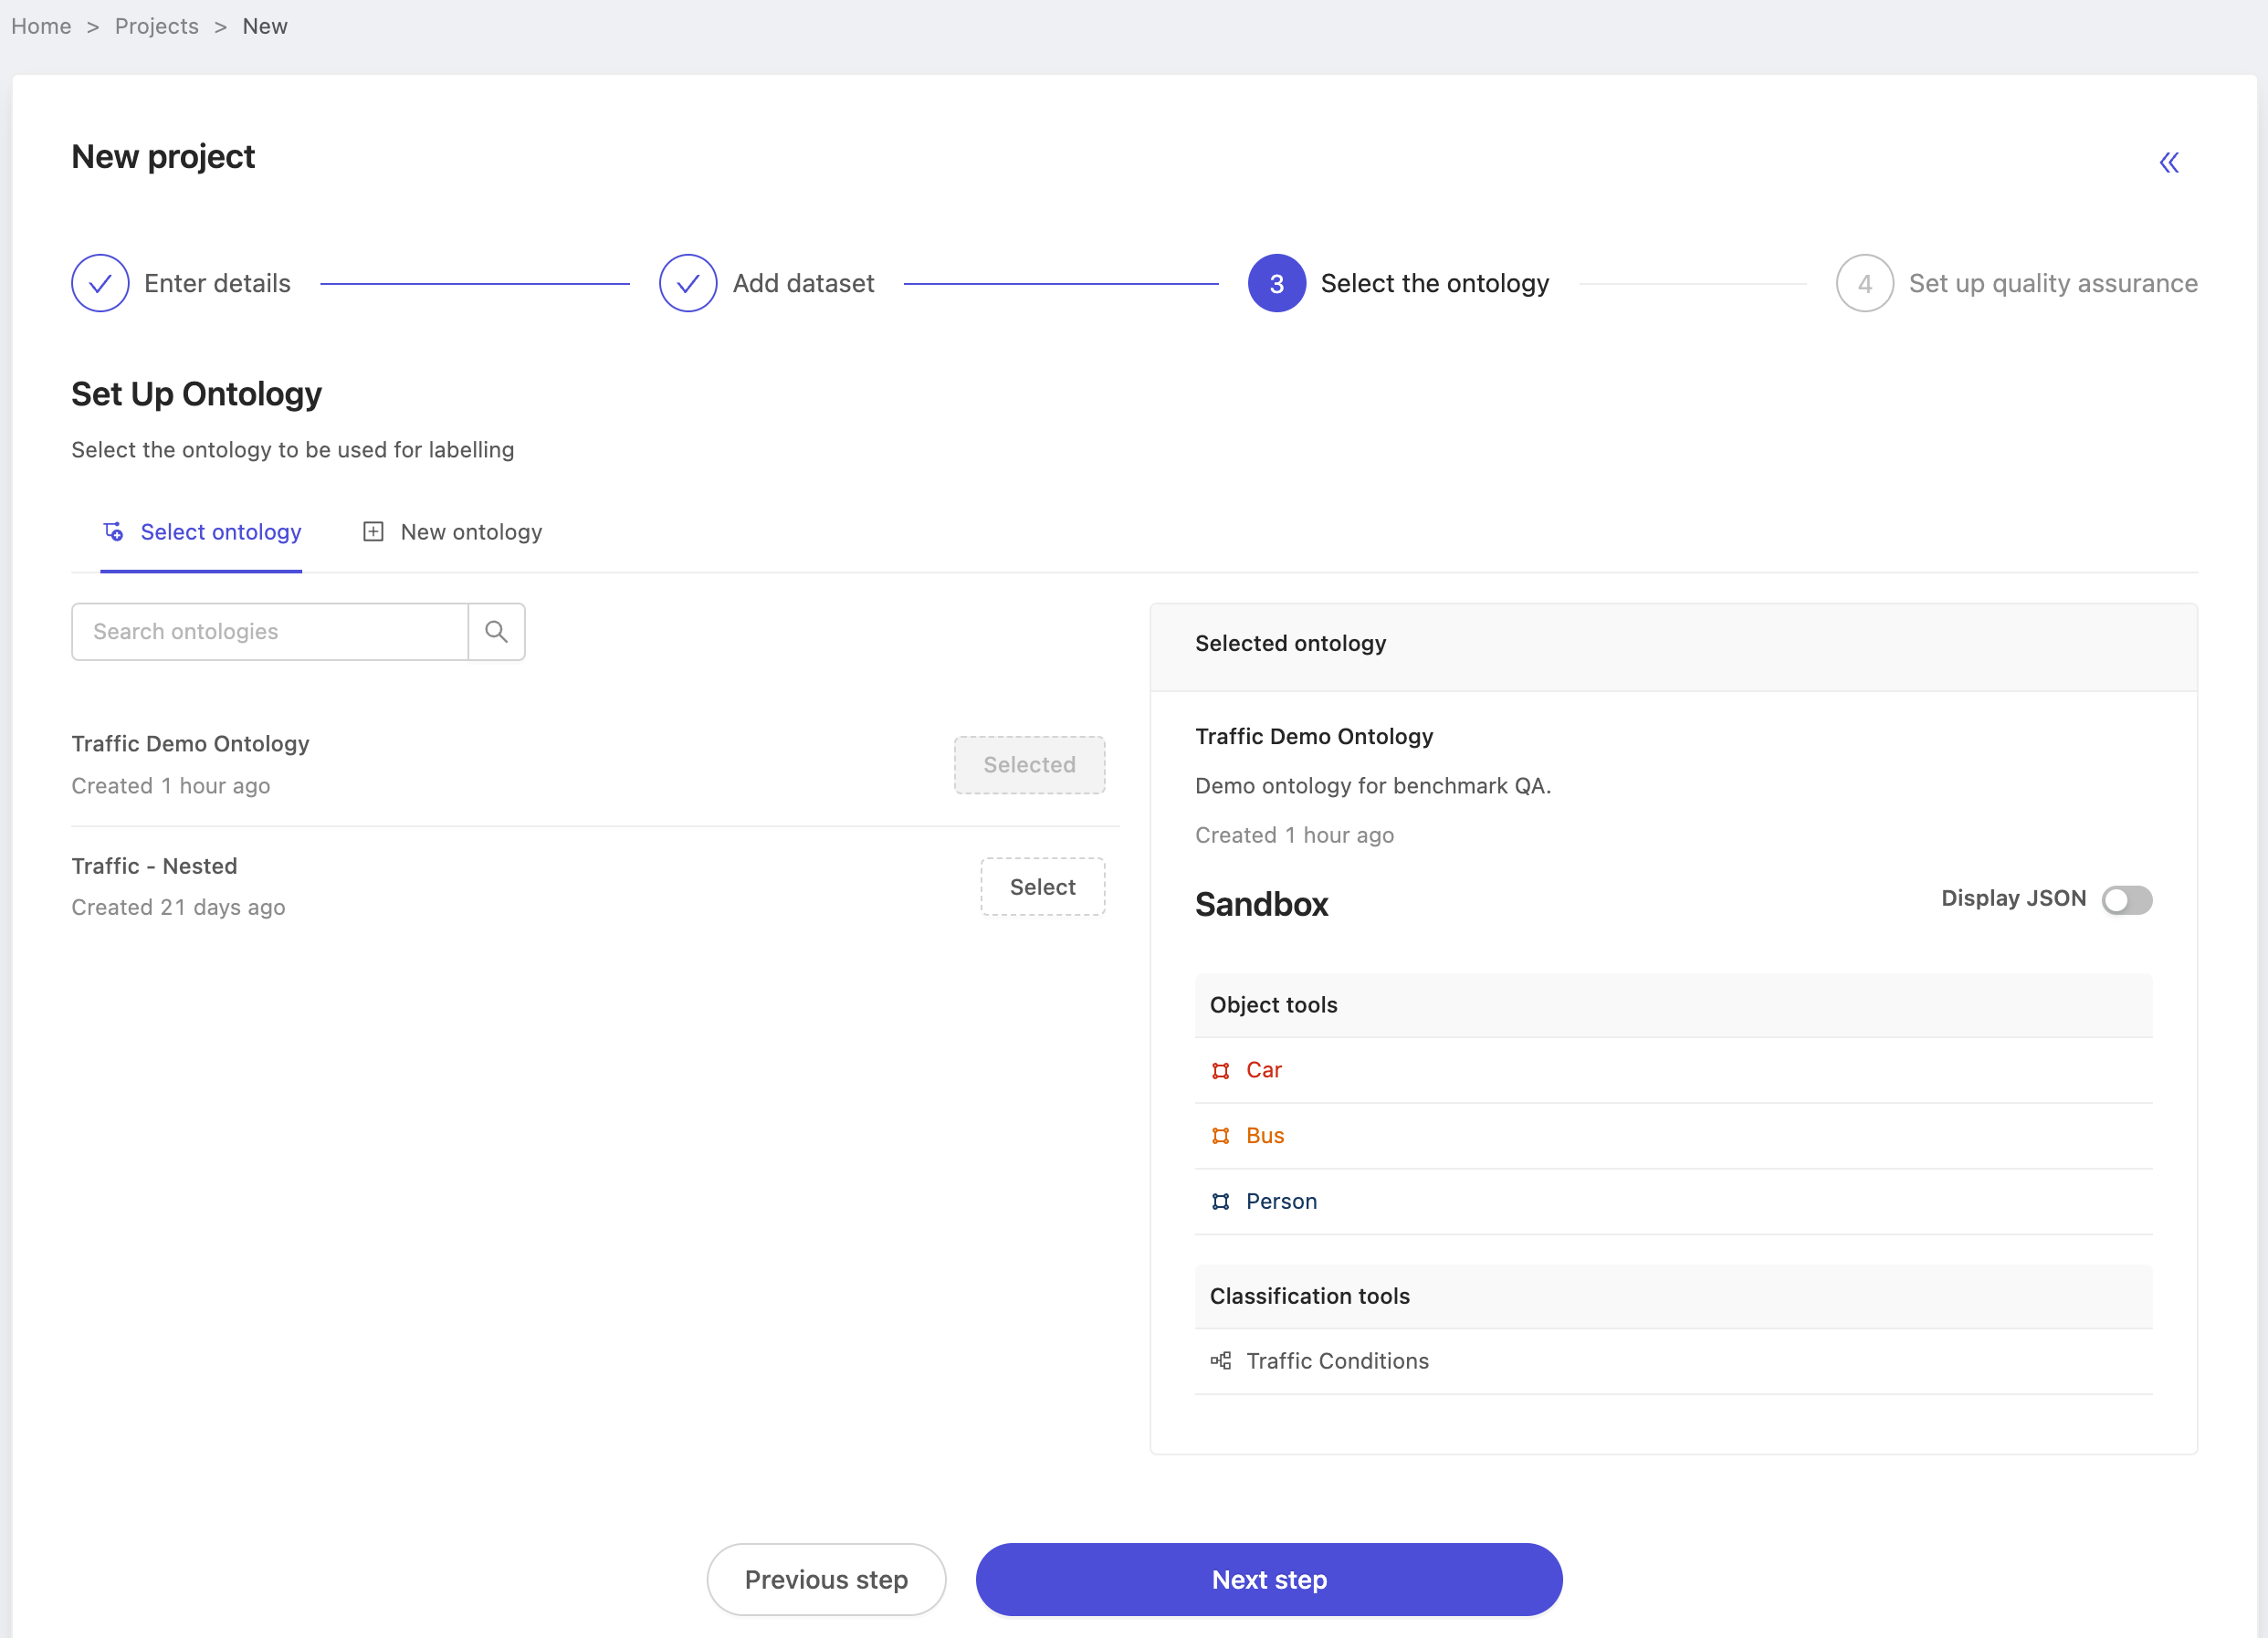
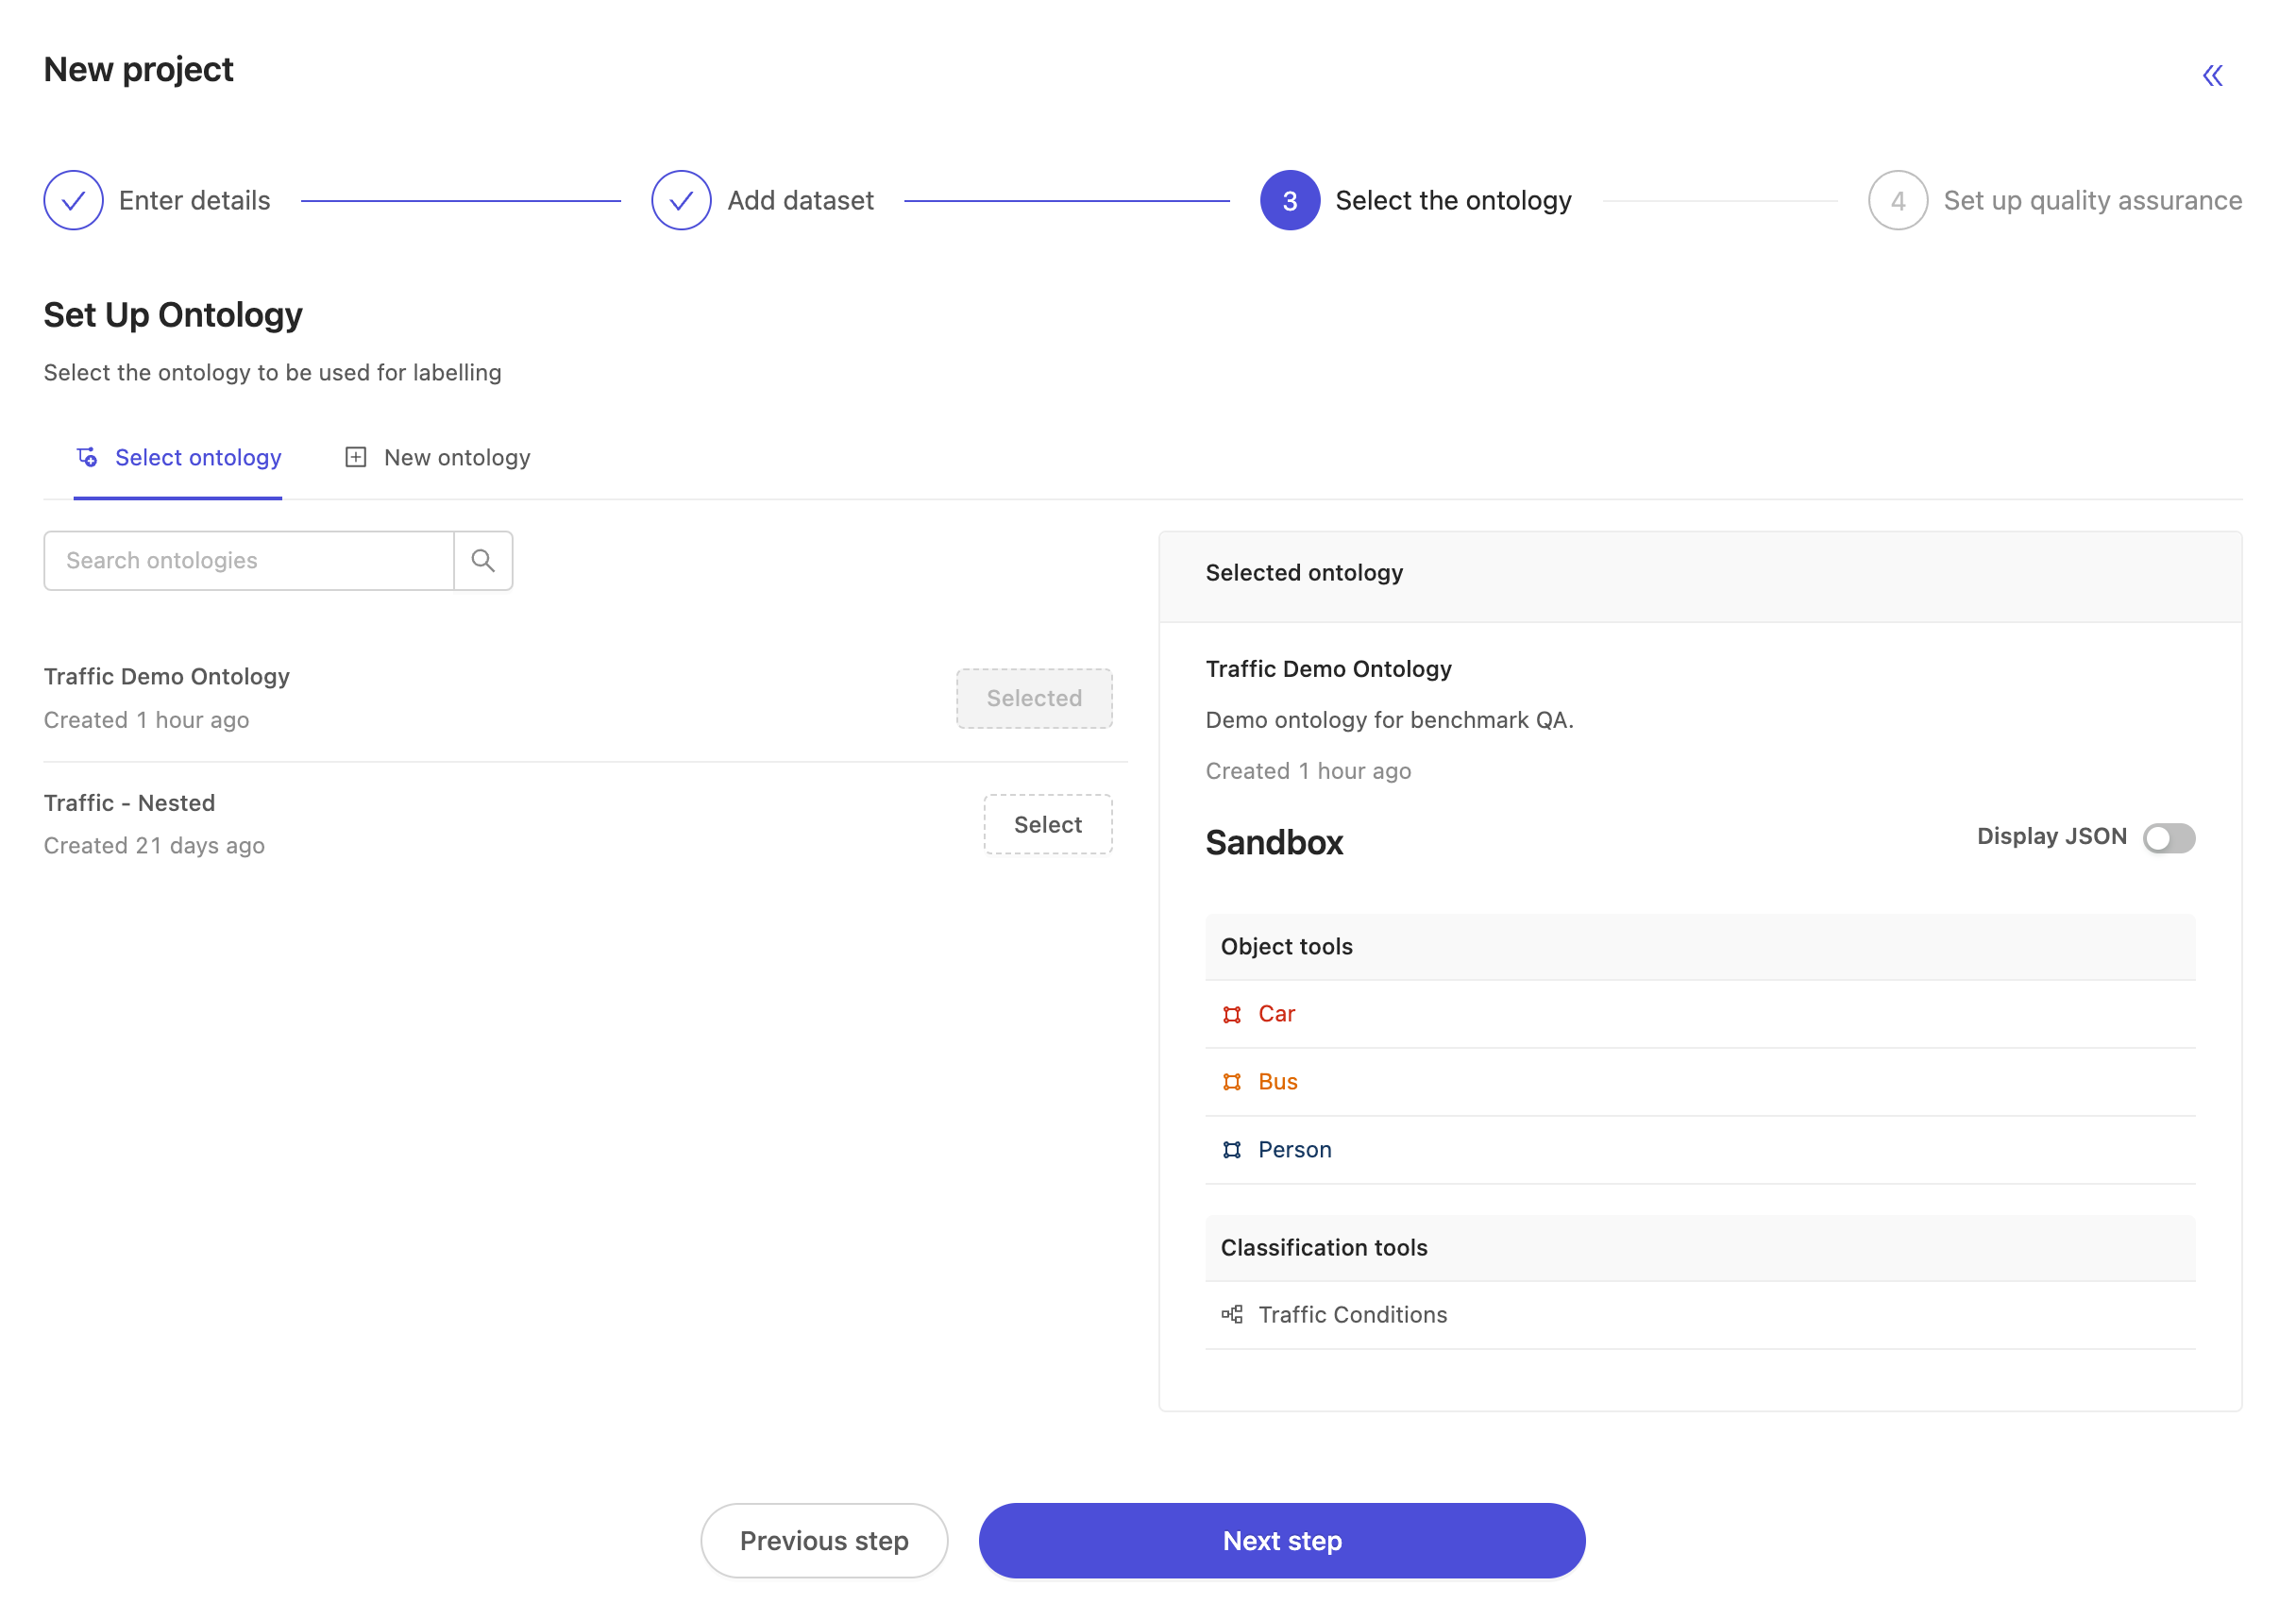
The 'Select ontology' screen is where you specify your ontology.
Note
DICOM customers might be more familiar with the term 'labeling protocol', which is equivalent to an ontology.
Encord offers support for objects within a frame, as well as frame level classifications, with nested attributes if need be.
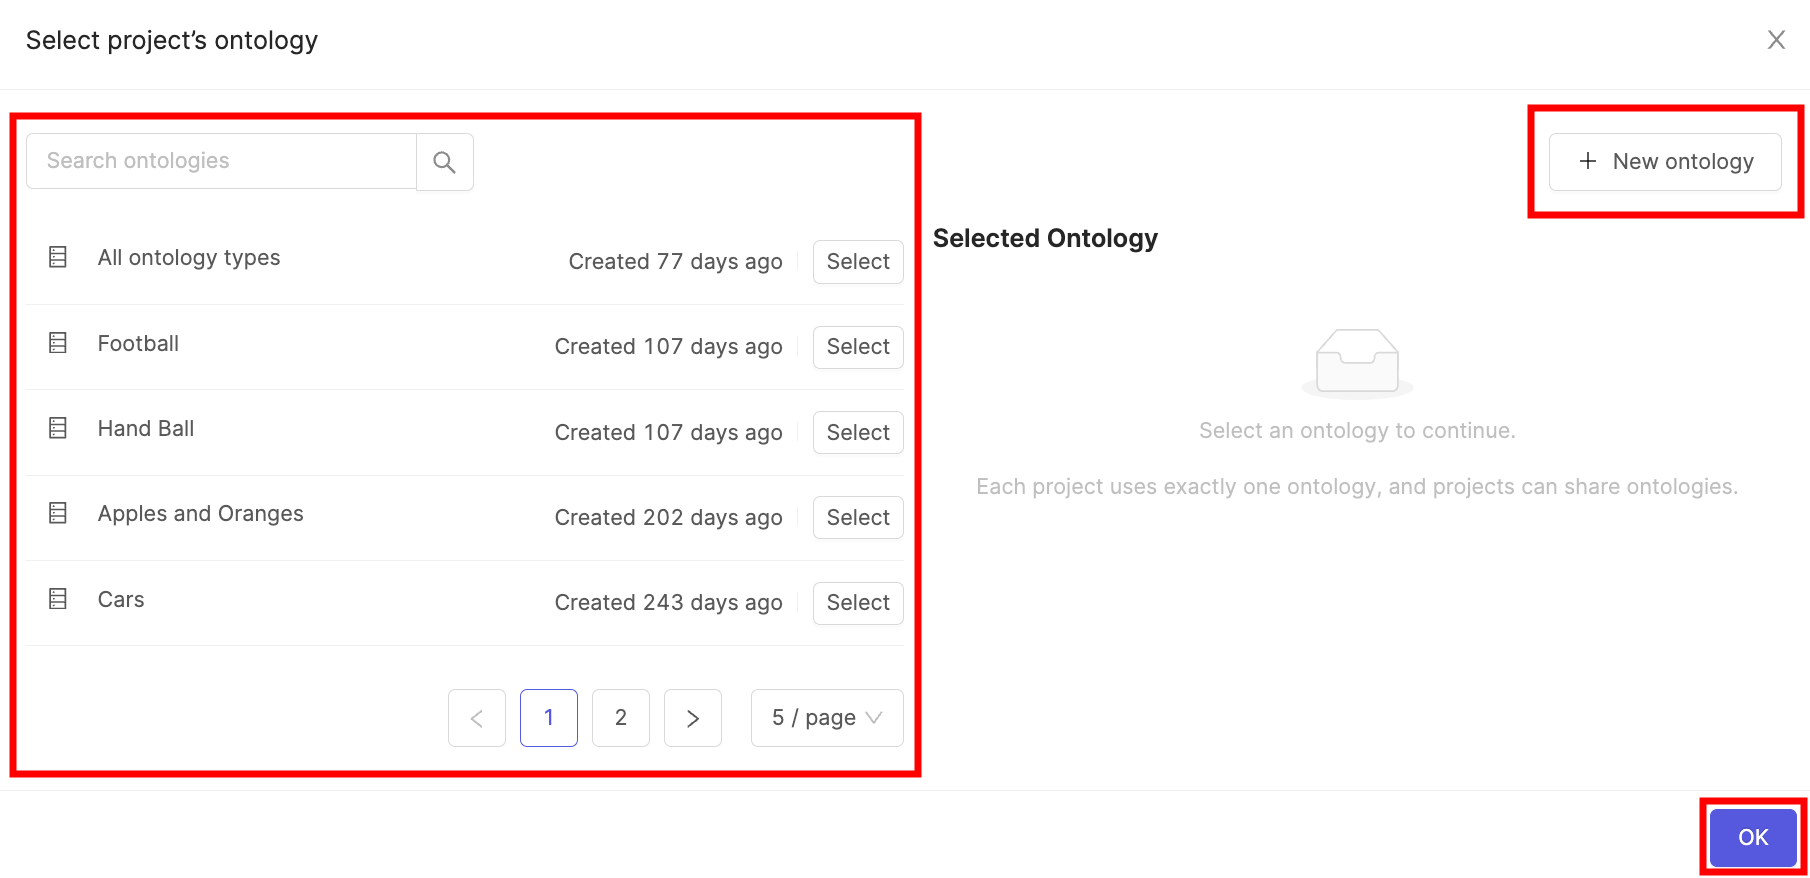
You can reuse a pre-existing ontology by clicking Select next to the ontology, or create a new one by clicking the + New ontology tab. A preview of the label editor sandbox for your chosen ontology will be shown on the right side of the screen.
Click Next step to continue creating your project.
4. Create the Benchmark QA project
Note
Benchmark QA projects are only available to select customers. Contact [email protected] for access.
- Select Automated QA in step 4 of the project creation process.
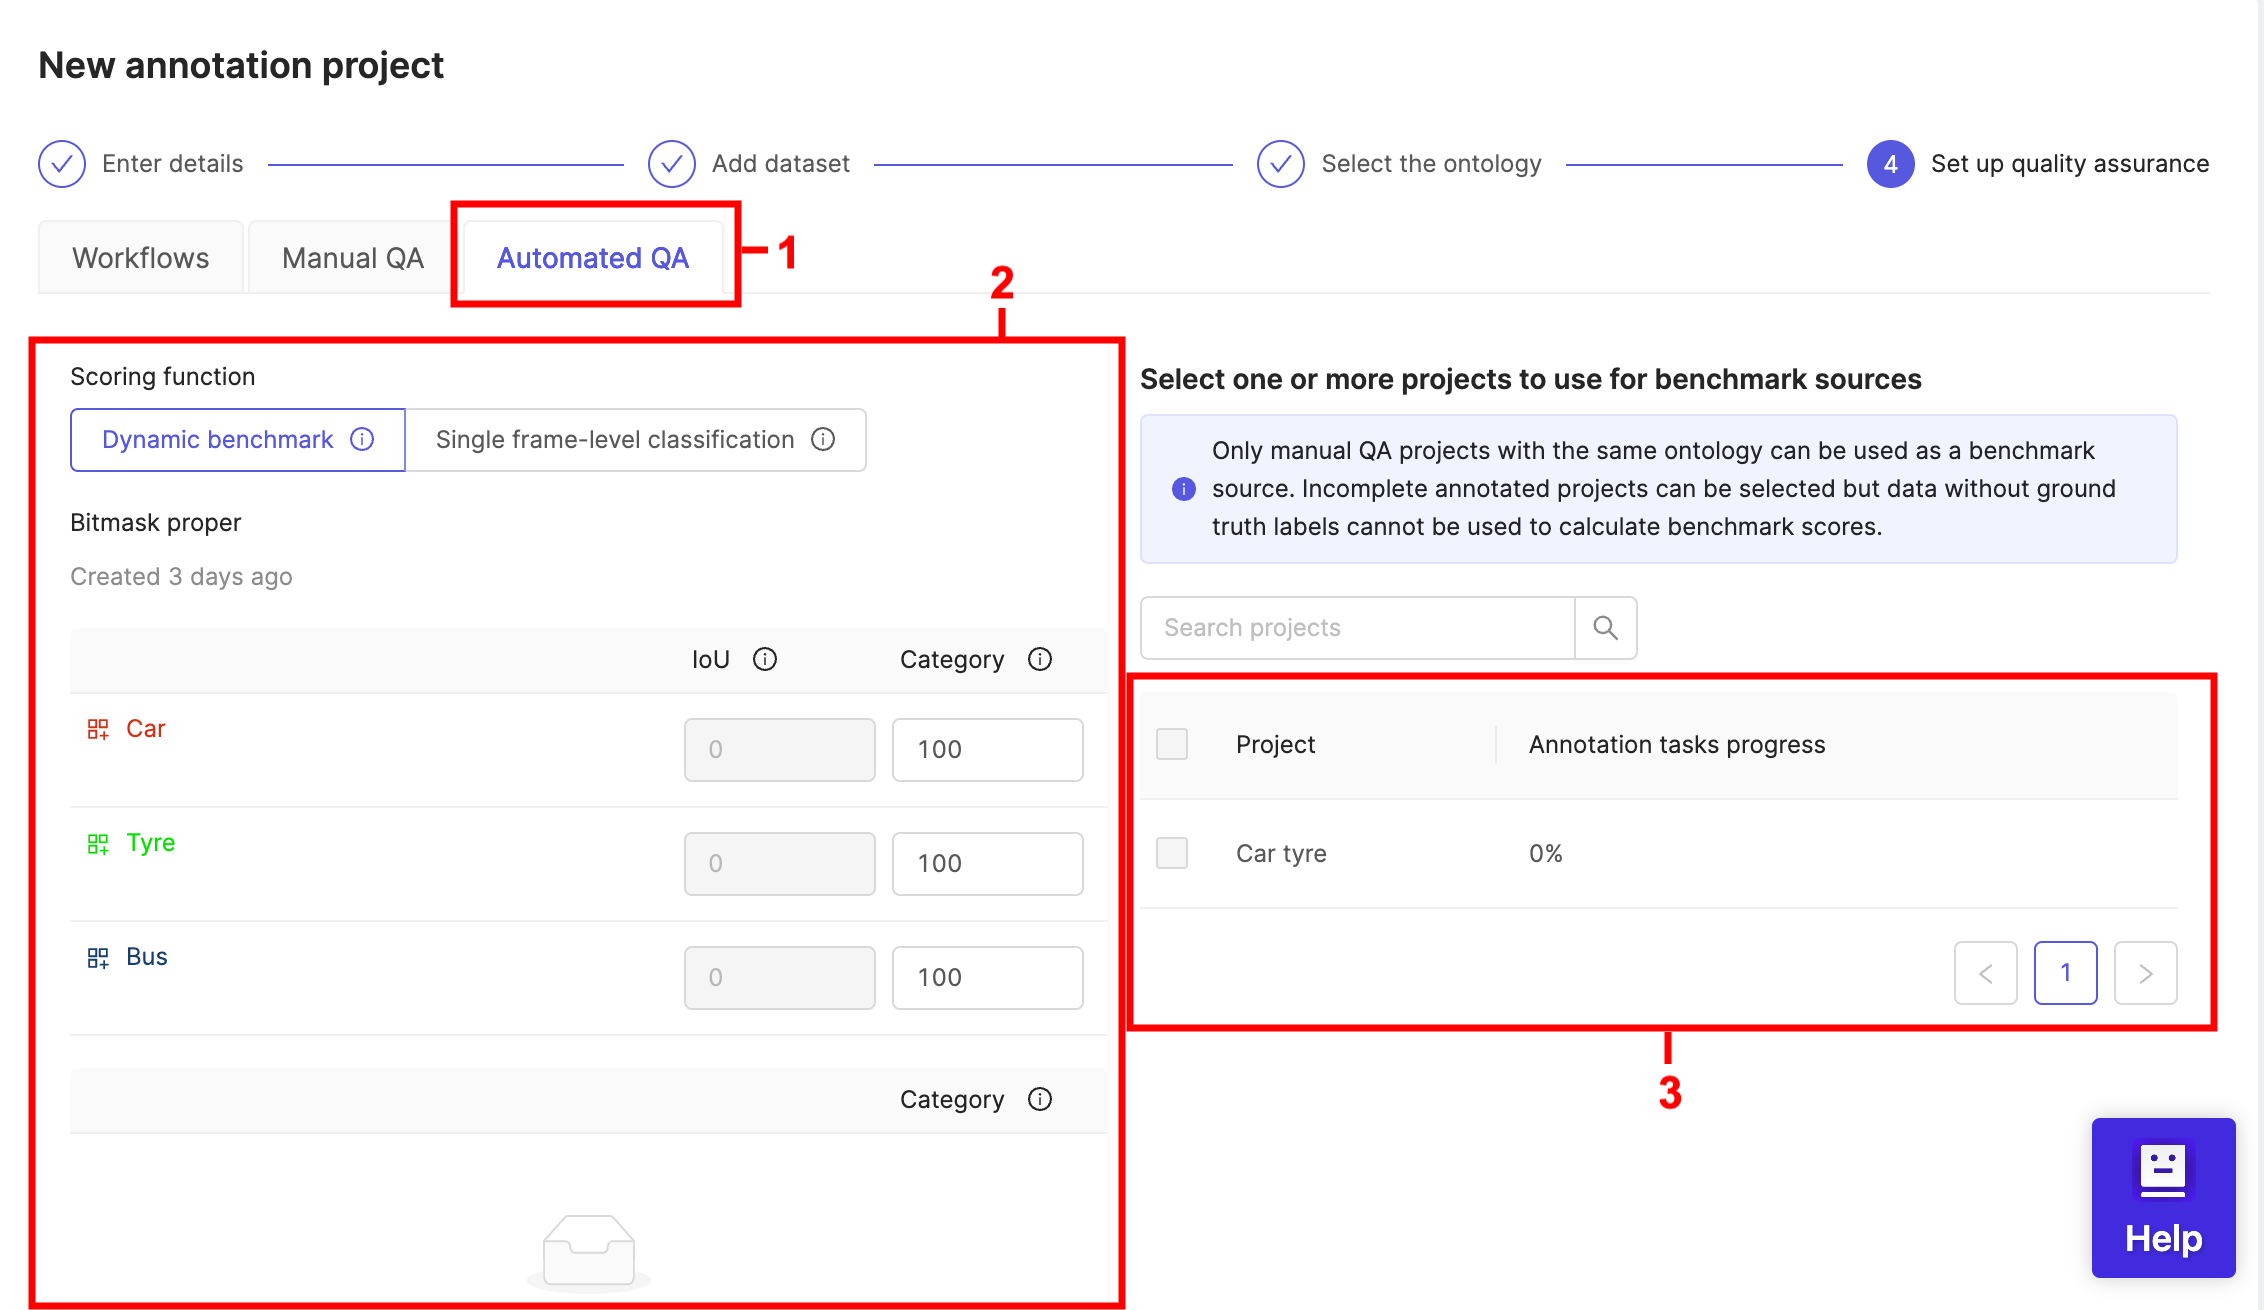
- Select your benchmark function.
-
Single frame-level classification only assesses classification instances.
-
Dynamic benchmark should be used for combinations of objects and classifications and can be calibrated by setting the relative weights of two evaluation metrics.
- Intersection over Union (IoU) is an evaluation metric which assesses the accuracy of labels compared to the ground truth / gold standard. If labels fully overlap with those in the ground truth full points will be awarded. Conversely, if there's no overlap between a label and the ground truth labels then no points will be awarded.
Note
For Keypoints the IoU represents a measure of distance between the annotator's point, and the benchmark point. The larger the distance, the lower the IoU score.
- Category is an evaluation metric based on correctly identifying the ontology category. In the example above correctly identifying an 'Apple' will award 100 points, while the wrong or a missing category will award no points.
Tip
IoU and Category values can be adjusted in the Settings tab after your project has been created.
- Select the Benchmark project source that will be used as the gold standard against which the performance of annotators will be assessed.
Roles and permissions
| Permission | Admin | Team Manager | Annotator |
|---|---|---|---|
| Attach / Detach datasets | ✅ | ❌ | ❌ |
| Attach / Switch ontology | ✅ | ❌ | ❌ |
| Benchmark QA | ✅ | ❌ | ❌ |
| Delete | ✅ | ❌ | ❌ |
| Invite team members | ✅ | ✅ | ❌ |
| Manage team permissions | ✅ | ❌ | ❌ |
| Manage admins | ✅ | ❌ | ❌ |
| Annotate tasks | ✅ | ✅ | ✅ |
| Control assignments & status | ✅ | ✅ | ❌ |
| View your team's performance | ✅ | ✅ | ❌ |
Benchmark Quality Assurance
Benchmark quality assurance reviews annotation tasks by comparing labels against a benchmark manual QA project which acts as a 'gold standard' - the 'benchmark project source'. This process completely removes the need for reviewers and improves the speed at which projects with the same ontology as the benchmark can be reviewed.
Tip
The terms 'Automated QA (Auto QA)' and 'Benchmark QA (BMQA)' are used interchangeably throughout the documentation.
Note
We do not currently support Benchmark QA projects for DICOM files.
Note
Benchmark QA projects need to have the same ontology as their benchmark project source.
Object annotation types
| Object annotation type | Benchmark QA Available? |
|---|---|
| Bounding box | ✅ |
| Rotatable bounding box | ✅ |
| Polygon | ✅ |
| Polyline | ❌ |
| Keypoint | ✅ |
| Bitmask | ❌ |
| Object primitive | ❌ |
Performance evaluation
Results of the Benchmark QA process for each annotator can be viewed on the Performance dashboard (if the projects has benchmark quality assurance). You can also export a CSV containing a breakdown of annotator performance for each instance.
Tip
For full details on the performance evaluation, contact your customer success manager.
Automatic QA walkthrough
Follow this walkthrough from beginning to end to learn how to set up a project which uses a set of ground-truth labels to perform automatic benchmarking of annotators while they process and label production data as well.
Using benchmark QA projects with benchmarks are a great option when you have a reliable repository of ground-truth labels and a large volume of data to label, which may not scale with a manual review process.
The ingredients
A benchmark QA project is formed from the following "raw ingredients":
-
A single shared ontology that is used in all the benchmark source projects and the benchmark QA project itself. It is essential that all projects use the exact same ontology, otherwise benchmark calculations cannot be performed.
-
Any number of benchmark source projects, which are composed as follows:
- the shared ontology from above.
- any number of datasets which you can confidently label.
- the labeled datasets, which form the set of ground-truth labels from the project.
- A single benchmark QA project which is composed as follows:
- the shared ontology from above.
- contains the production data you want labeled.
- references the benchmark source projects.
- a configurable benchmark function which controls how annotators are scored on benchmark tasks.
Now that we know our ingredients, let's get to work assembling the benchmark QA project. For the purposes of this guide, we're going to walk through creating a coherent set of the ingredients above, but if you feel you already have the know-how for any given section, feel free to skip ahead to the areas of interest.
The creation recipe
1. Ontology
If you do not yet have any of the benchmark source projects, you'll first need to create an ontology. The steps are illustrated in general in our ontology creation documentation, but follow along below for the ontology we will use in this walkthrough.
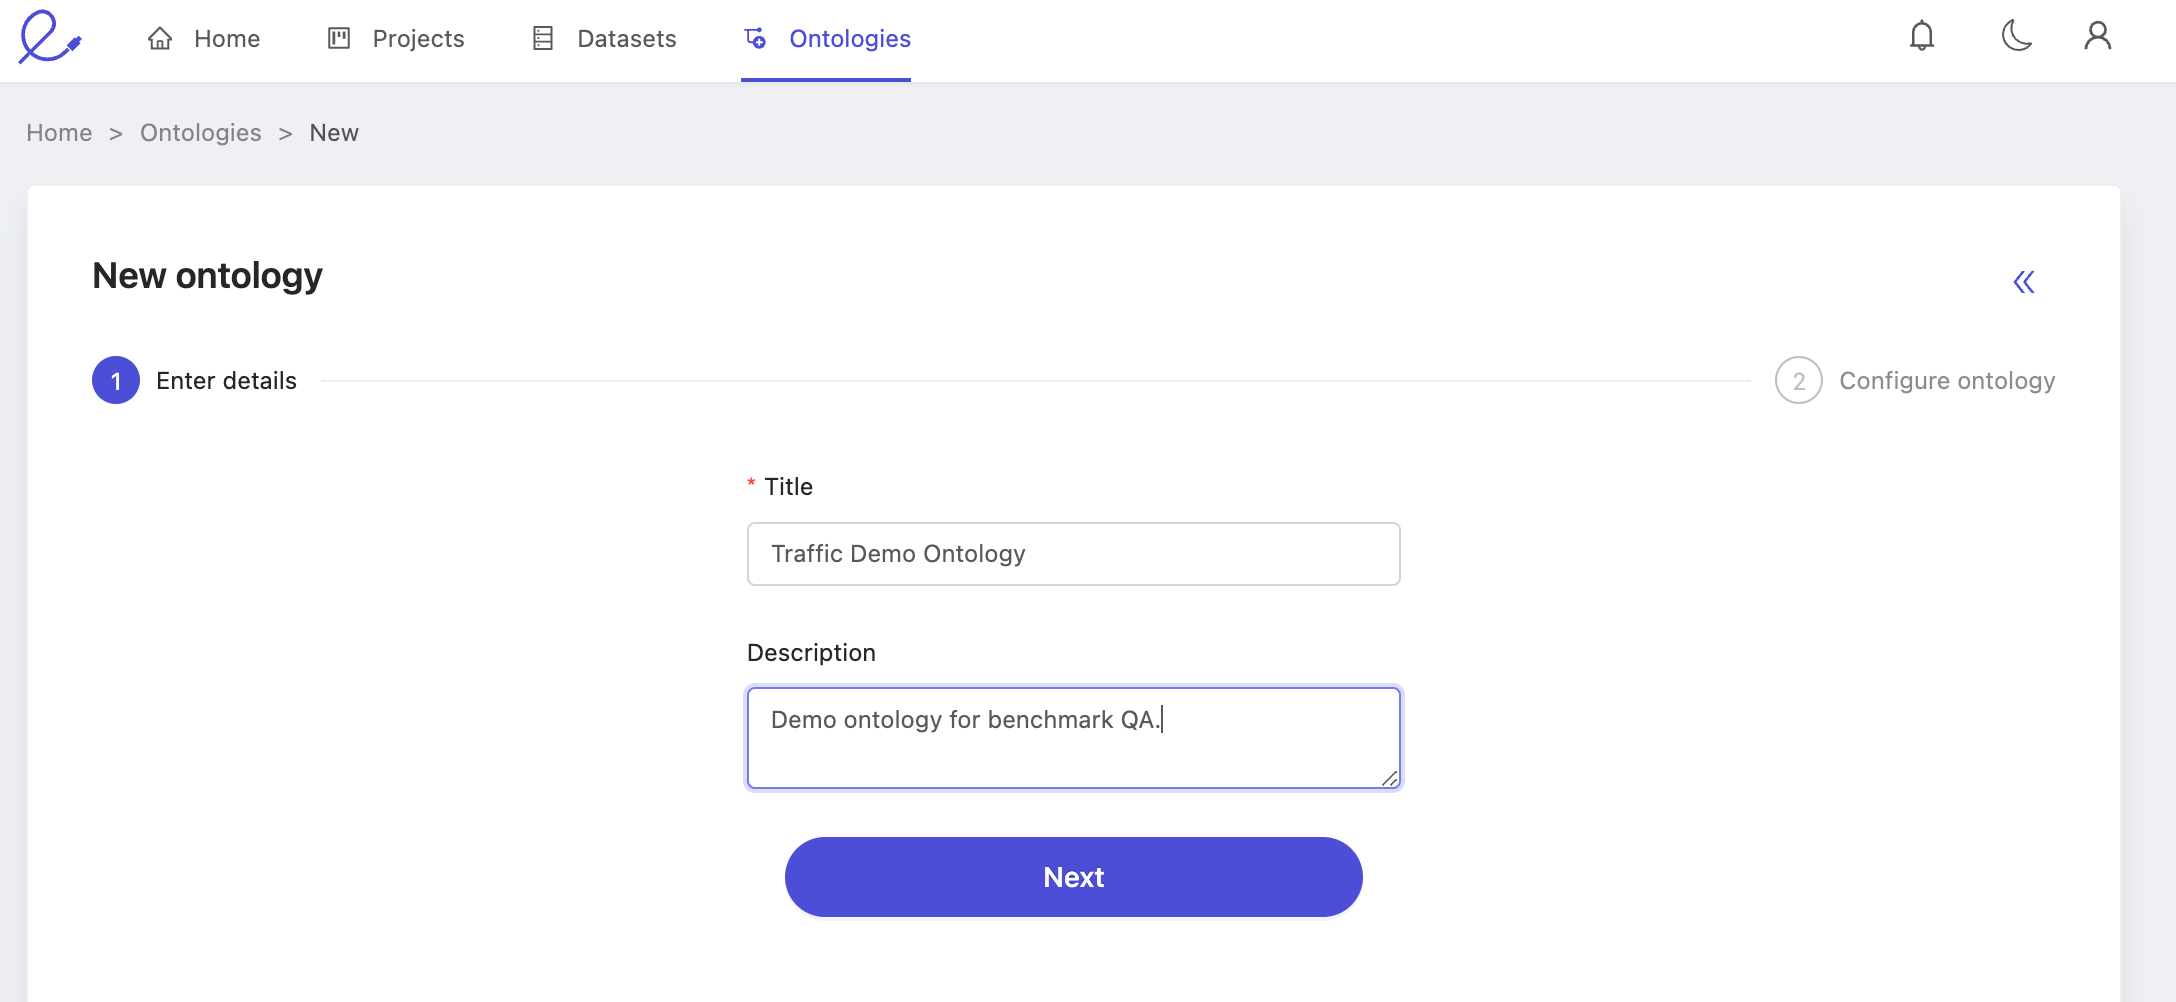
Follow the 'Create ontology' flow from the ontologies overview list, and enter easy to recognize name and description.
Of course, be sure you're satisfied with the structure as well.
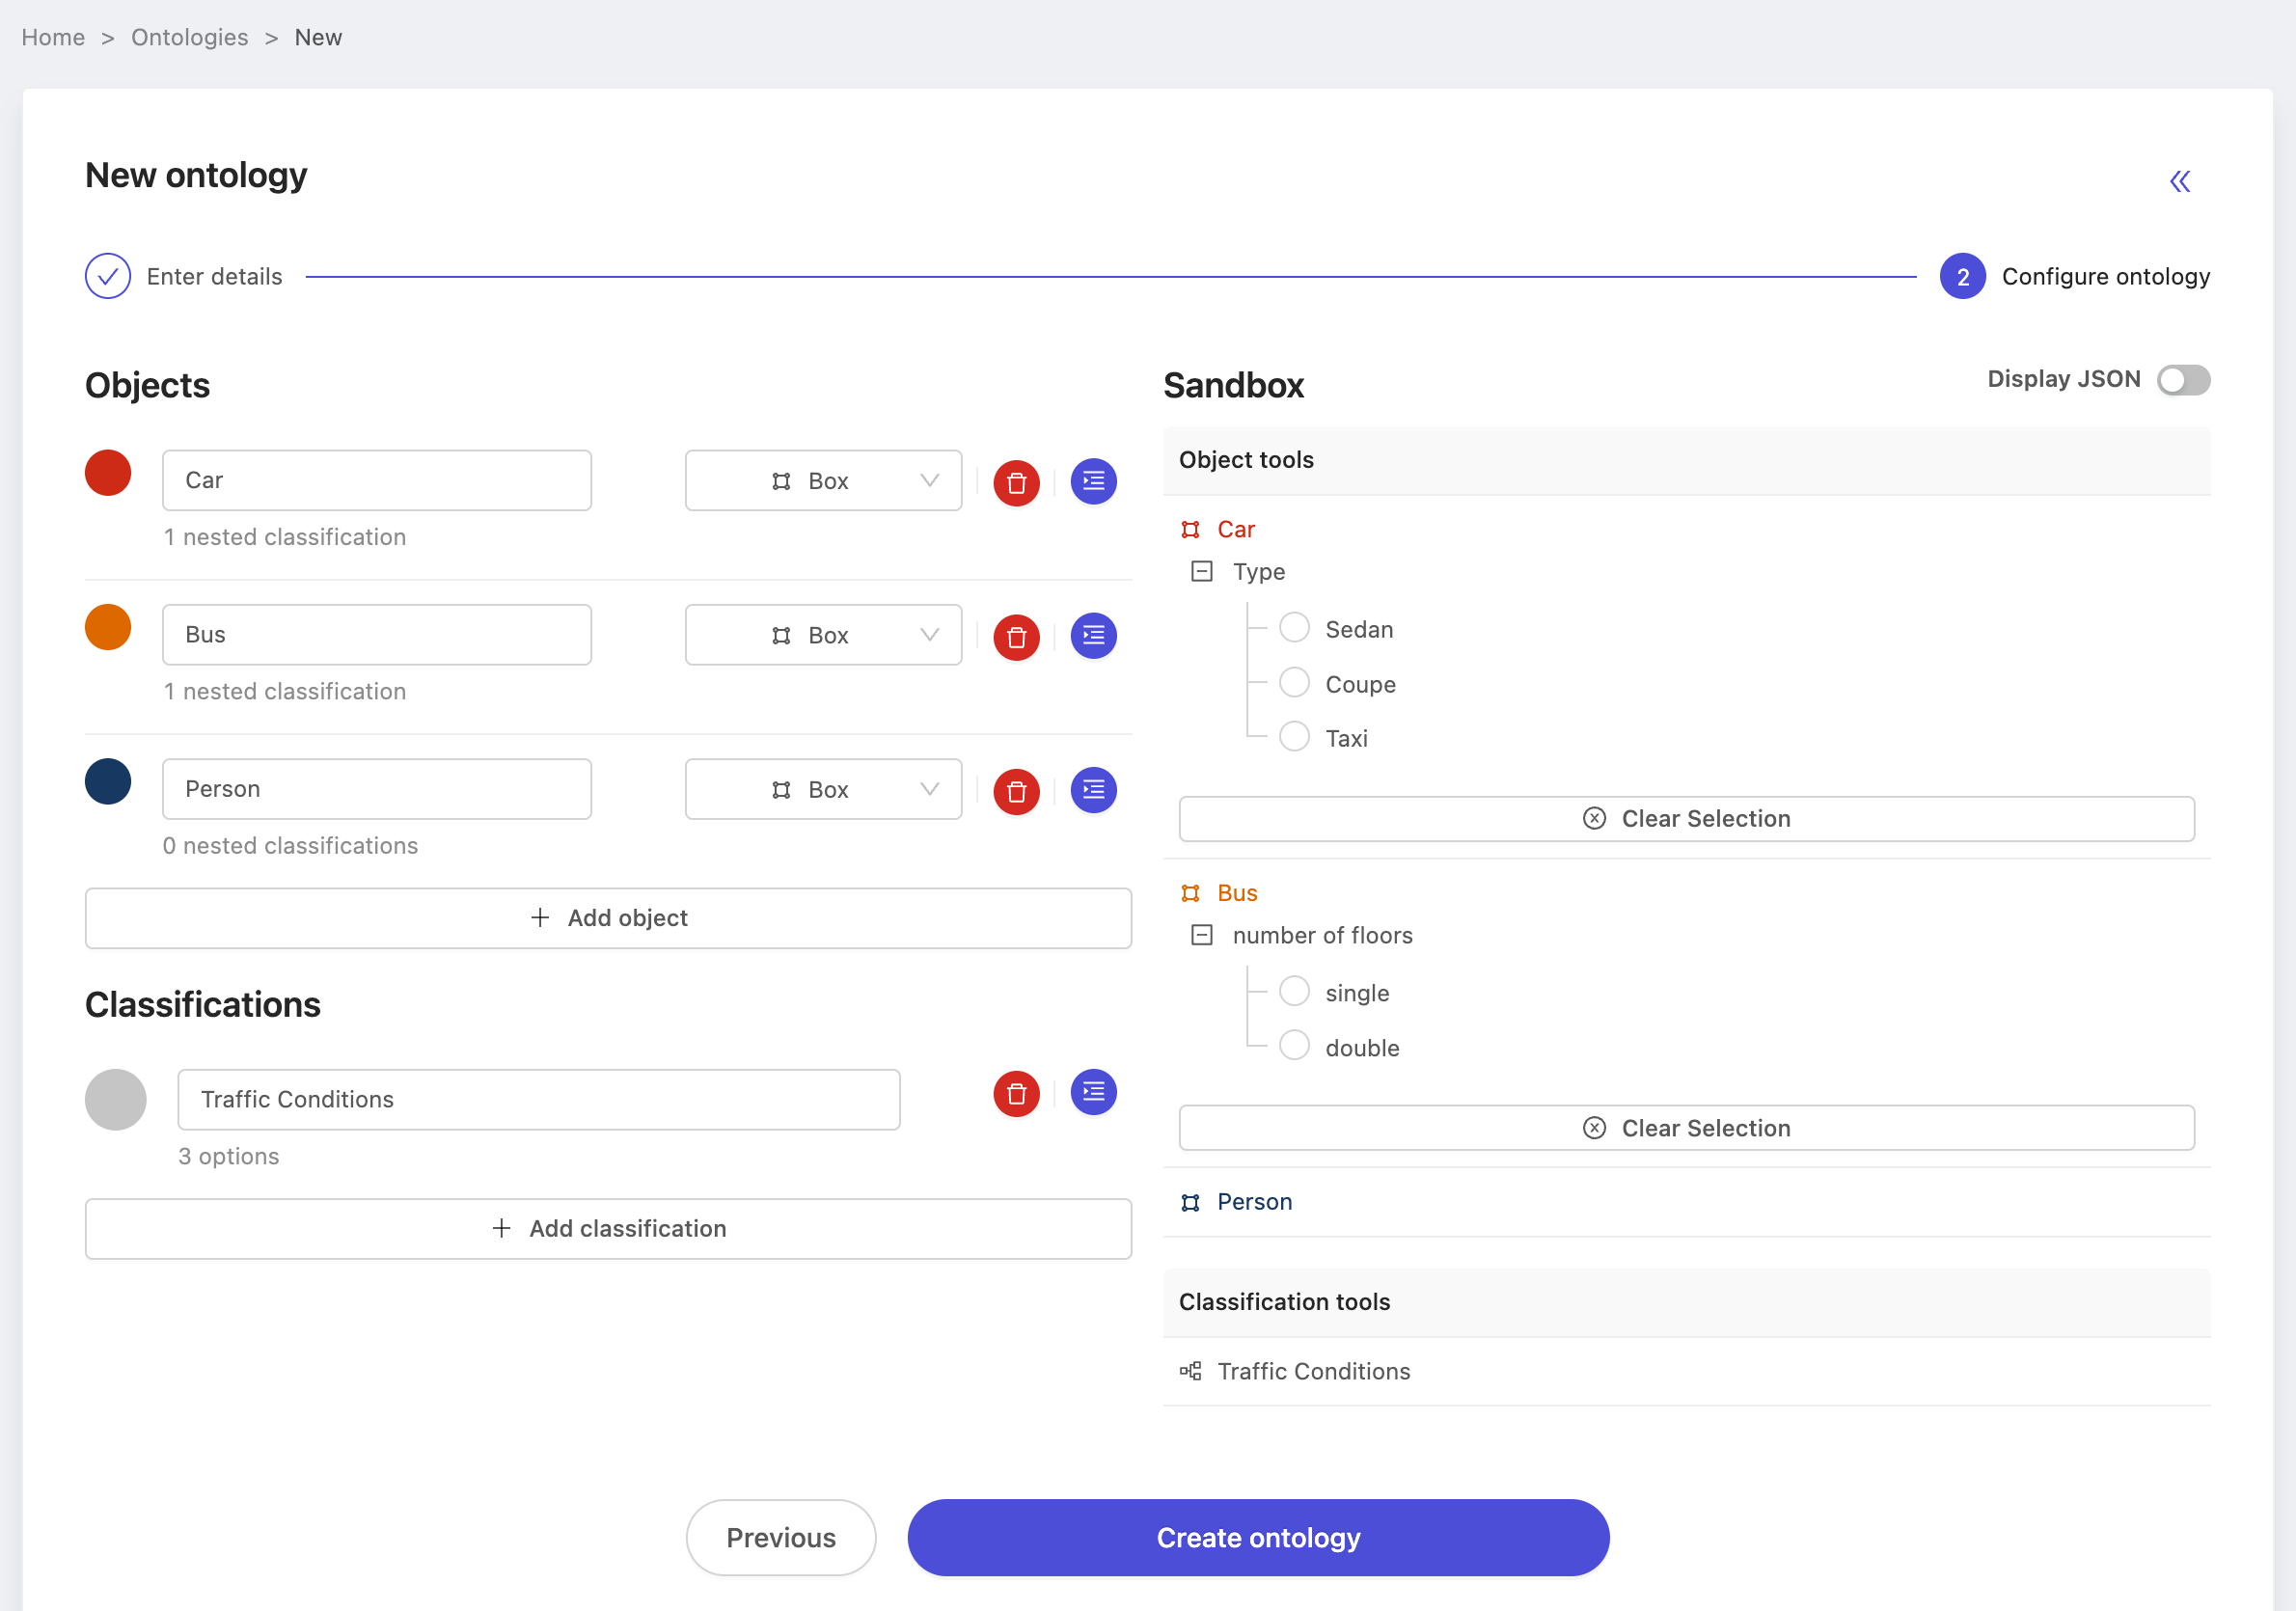
Press Create ontology and we'll move onto creating the benchmark source project. But first, make a note of the name of the ontology, we'll need it multiple times throughout this process. In this case, we've named our ontology: Traffic Demo Ontology.
2. Benchmark source project(s)
You will have to create at least one benchmark source project before you can create the benchmark QA project itself. A project must have at least one label task that has been submitted and is in the 'review' or 'completed' state for it to be selectable as a benchmark source project. While we only enforce "at least one", the more labels that have been the more labeling tasks can be used as benchmark tasks.
Benchmark source dataset(s)
The next step after preparing an ontology is preparing a dataset for annotation. In this case, choose a dataset you know can be labeled with confidence, as the labels in this project on this dataset will serve as the ground-truth labels.
Consult our dataset creation documentation for a reminder on how to create datasets. The following image depicts our dataset with data uploaded and initialized and ready to be used in the benchmark project.
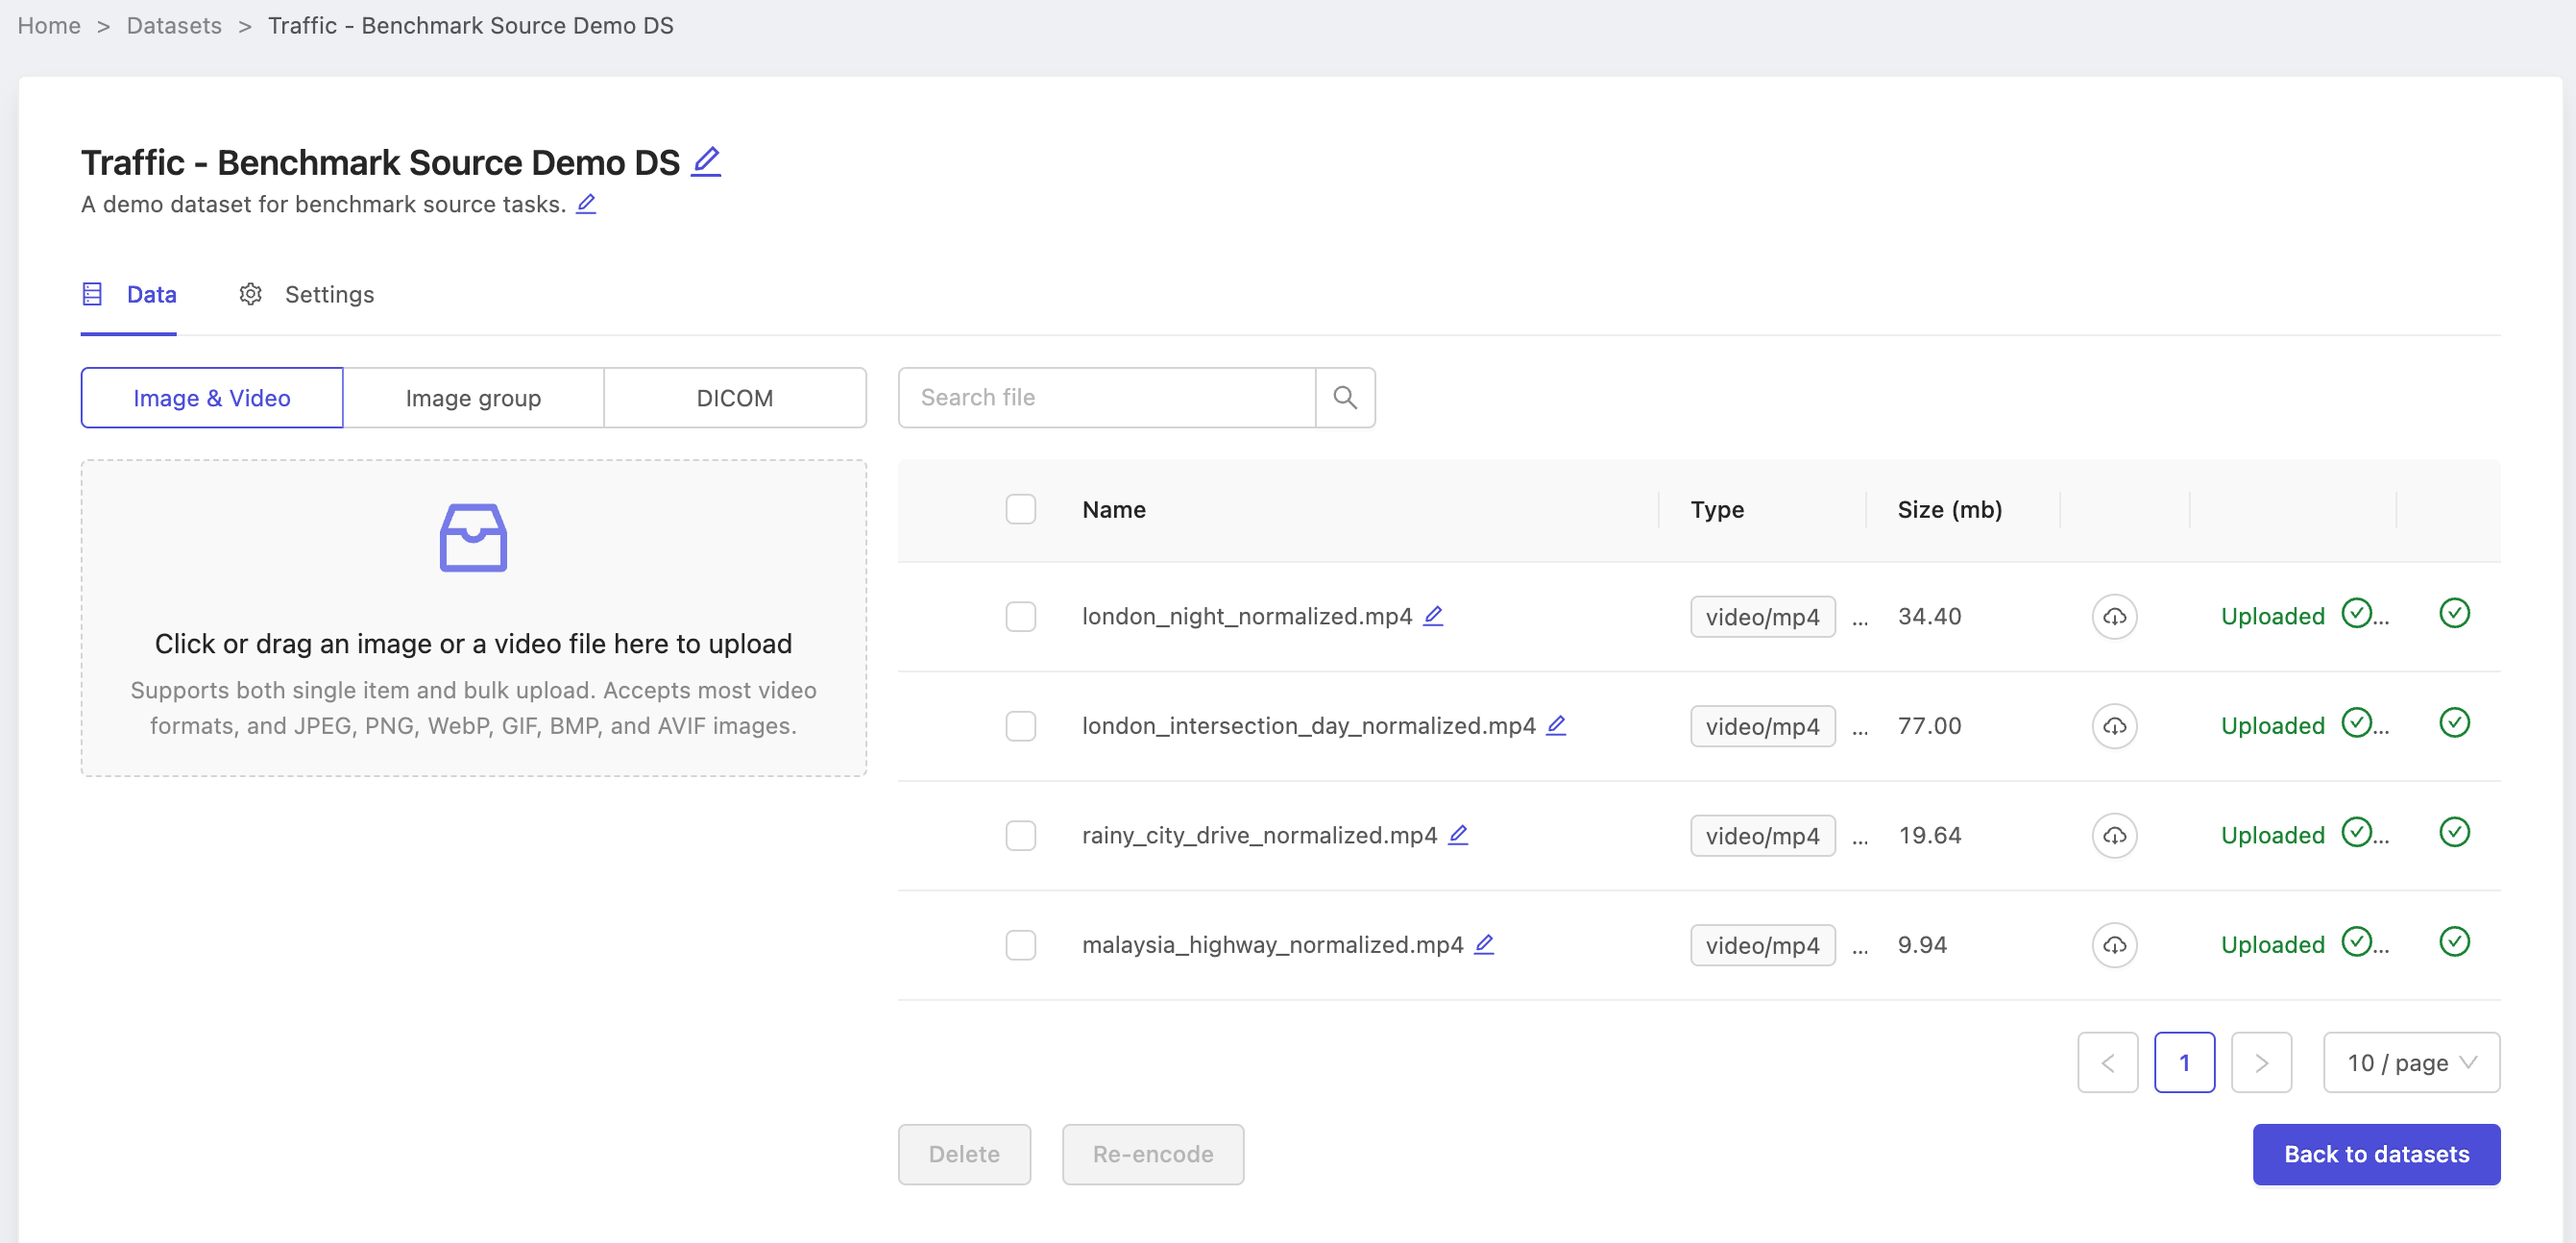
Note the name of our dataset Traffic - Benchmark Source Demo DS, as we will need it when creating the source project.
Creating the source project(s)
Follow the Starter Guide if you're completely new to the platform, or just use the create project documentation if you need a quick reminder. Follow along below we create a benchmark source project from the ontology and dataset we just prepared.
On the dataset selection step, be sure to choose the same dataset you prepared above. In this case, we choose the dataset named Traffic - Benchmark Source Demo DS.
When configuring the ontology, choose the ontology you created earlier. In this case, we select Traffic Demo Ontology.
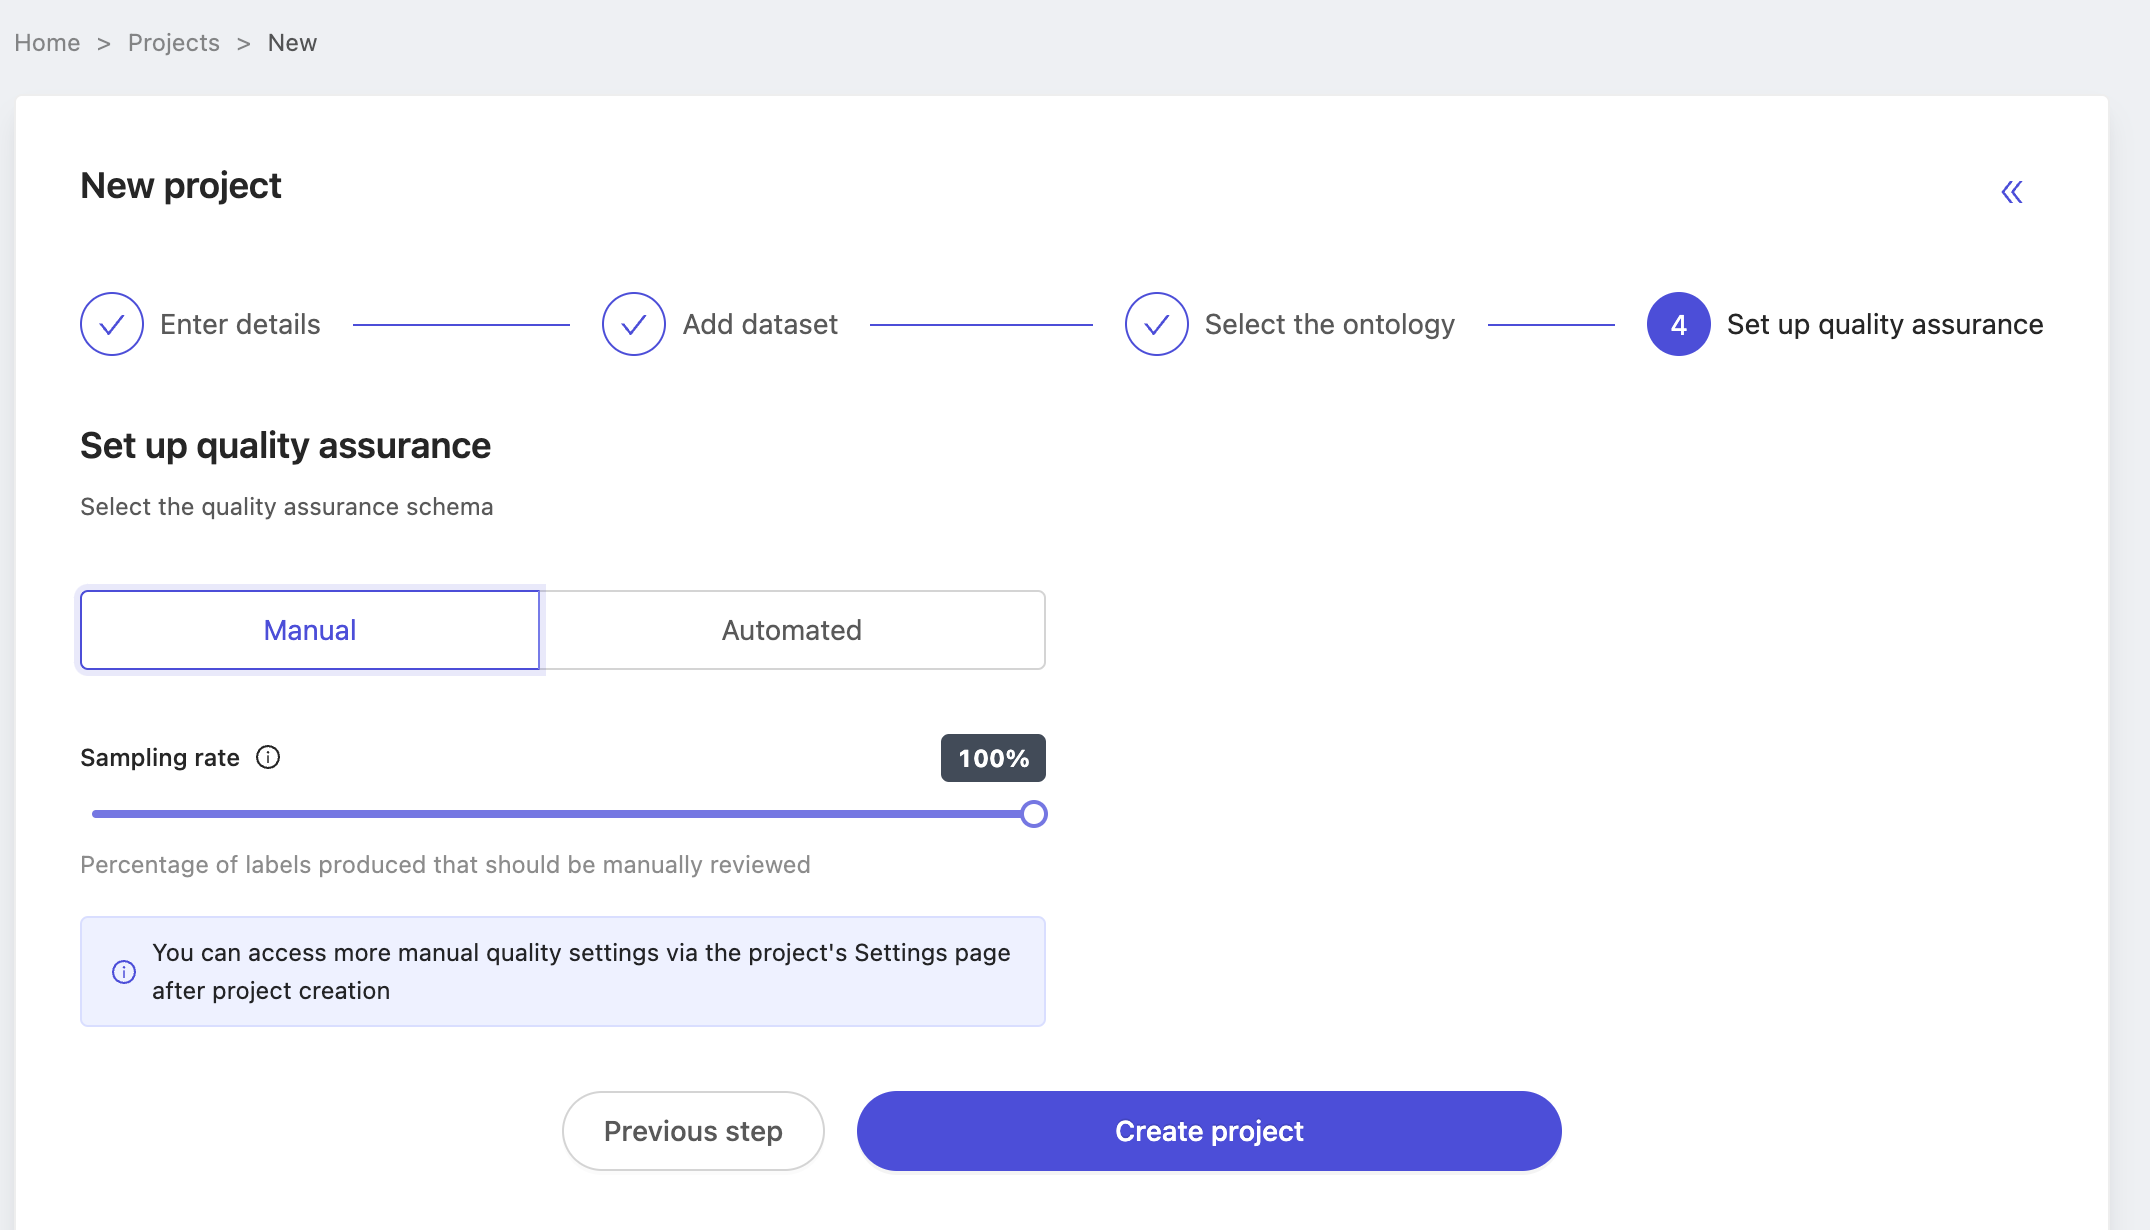
Finally, benchmark source projects are done using the manual QA method that Encord has supported up until now. Choose manual QA, configure the sampling rate and create your project! In this case we've left the sampling rate at 100%, but in practice the sampling rate does not matter for source projects. Labels must simply be in either the 'In review' and 'Completed' state to be used as a benchmark label. Therefore, choose the sampling rate that works for you. You can always adjust it later.
Create ground-truth labels
Projects which don't have any labels in the 'In Review' or 'Completed' state can't be used as source projects. In your real applications, you may determine ground-truth labels through a process of review and alteration labeling in the app, or use our SDK to upload labels from outside Encord.
Ensure that at least several labels are either 'In Review' or 'Completed' as below, before moving on to benchmark QA project.
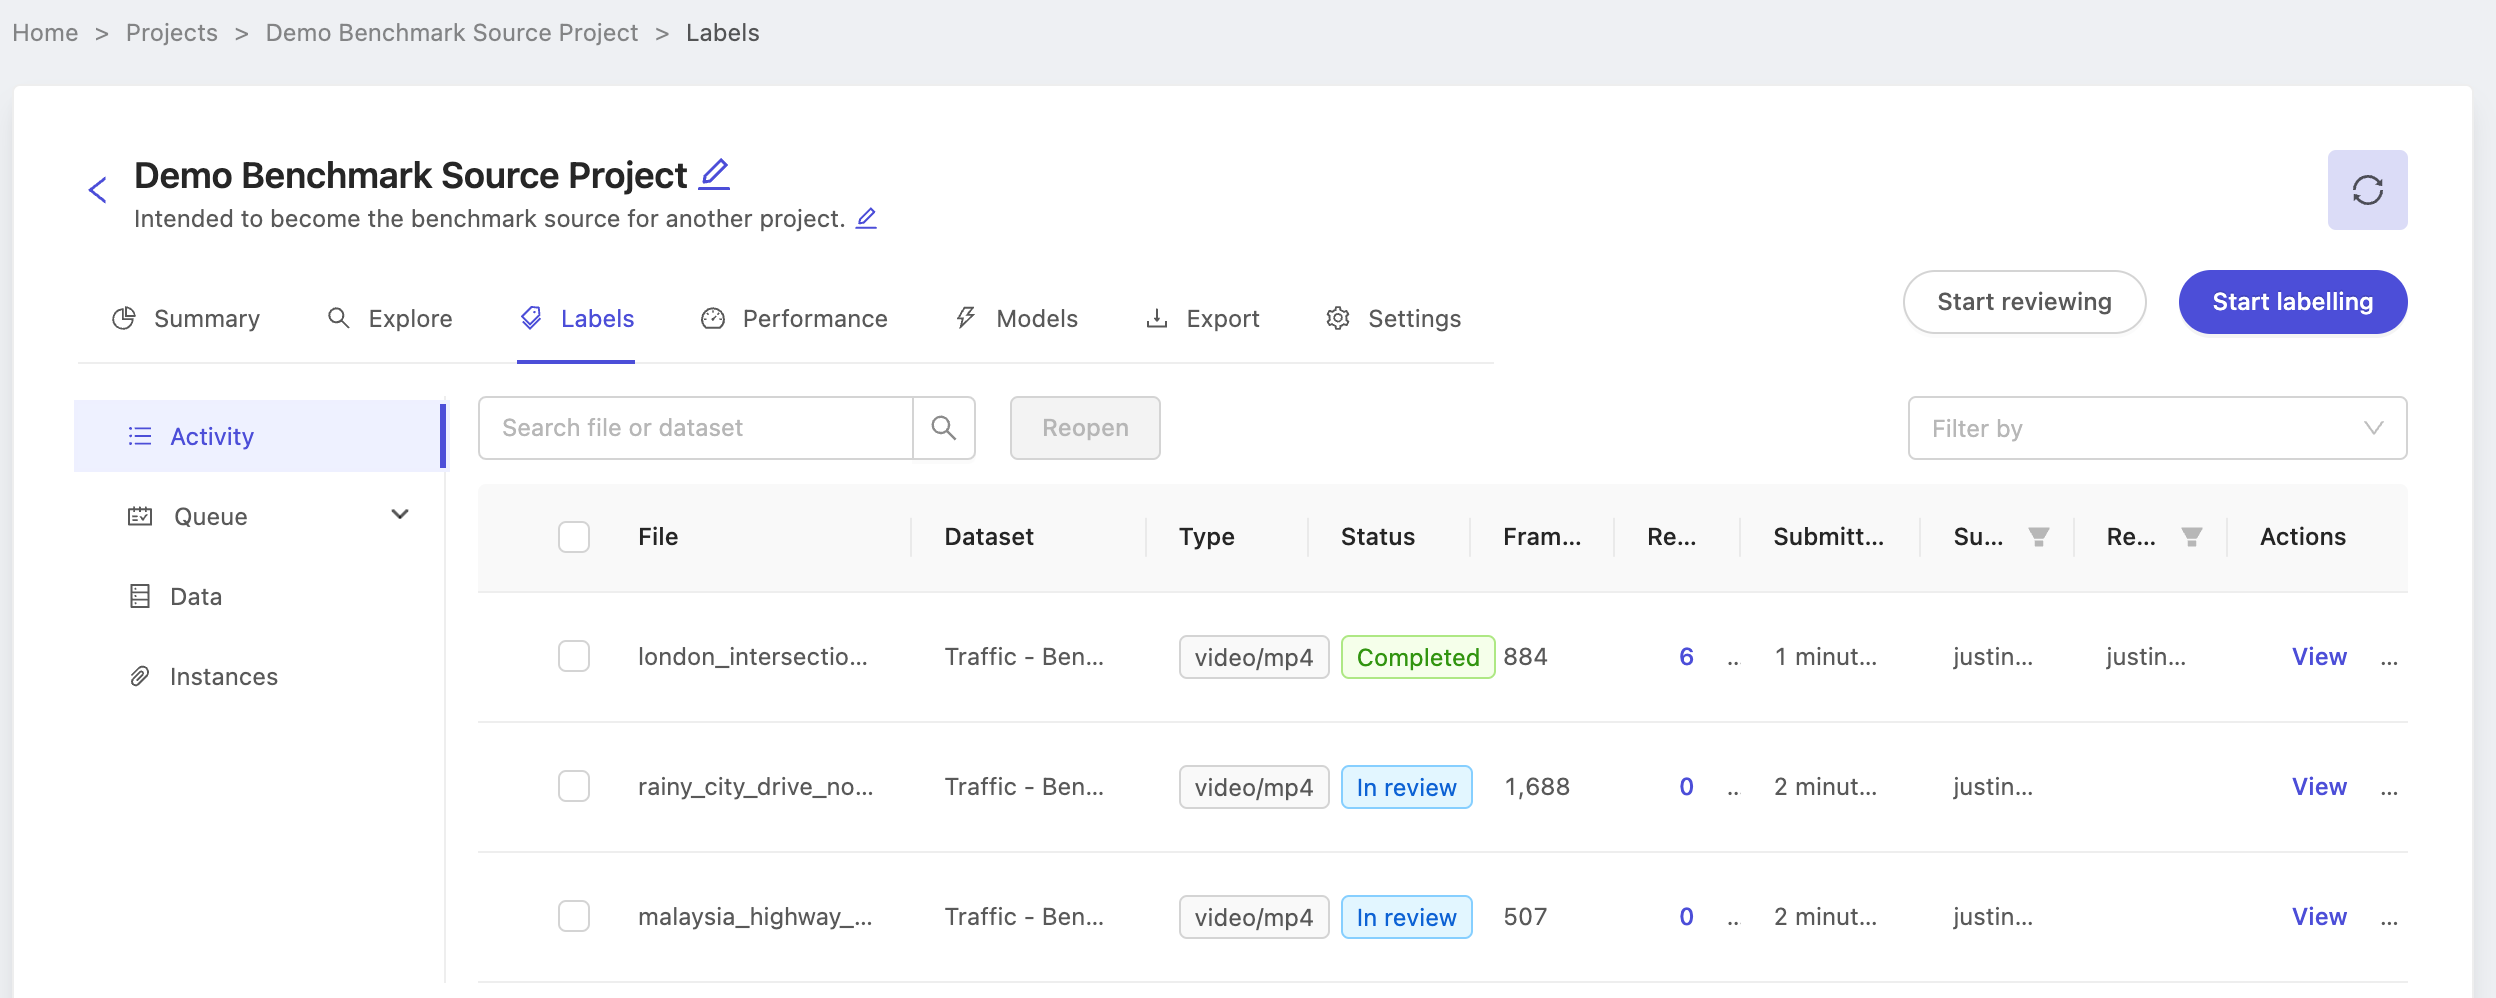
With the benchmark project created and ground-truth labels ready, it's time to create the benchmark QA project. Again, note the name of the project Demo Benchmark Source Project as we'll use it while configuring the benchmark QA project.
3. Benchmark QA project
Creating a benchmark QA process is much like creating a normal project, except for configuring the QA mechanism at the end of the creation process. Follow along below as we walk through creating a benchmark QA project.
Start by clicking the +New project button from the projects list, and enter the title, description and any organization tags you need as normal.
For the dataset, choose the dataset of the unlabeled production data you want annotators to label. In this case, our dataset is named Traffic - Demo Production Data. Take particular care to not select the source dataset! You may of course select more than one dataset if you wish.
Next, select the ontology. At this stage you may select any ontology, but to have a working benchmark function, it's important to choose the same ontology that we set up earlier. In this case, we choose the ontology named Traffic Demo Ontology.
At the final "setup quality assurance" step, select "Benchmark QA" to make the project a benchmark QA project. The choice of QA methodology for a project is final at creation time. Projects created as benchmark QA projects can't be set to manual QA projects at a later time, and vice versa. By choosing to make a project a benchmark QA project, the list of possible source projects is automatically populated with projects meeting the following criteria:
- Use the same ontology as was selected to create this benchmark QA project.
- Have at least one label with status 'In review' or 'Completed'.
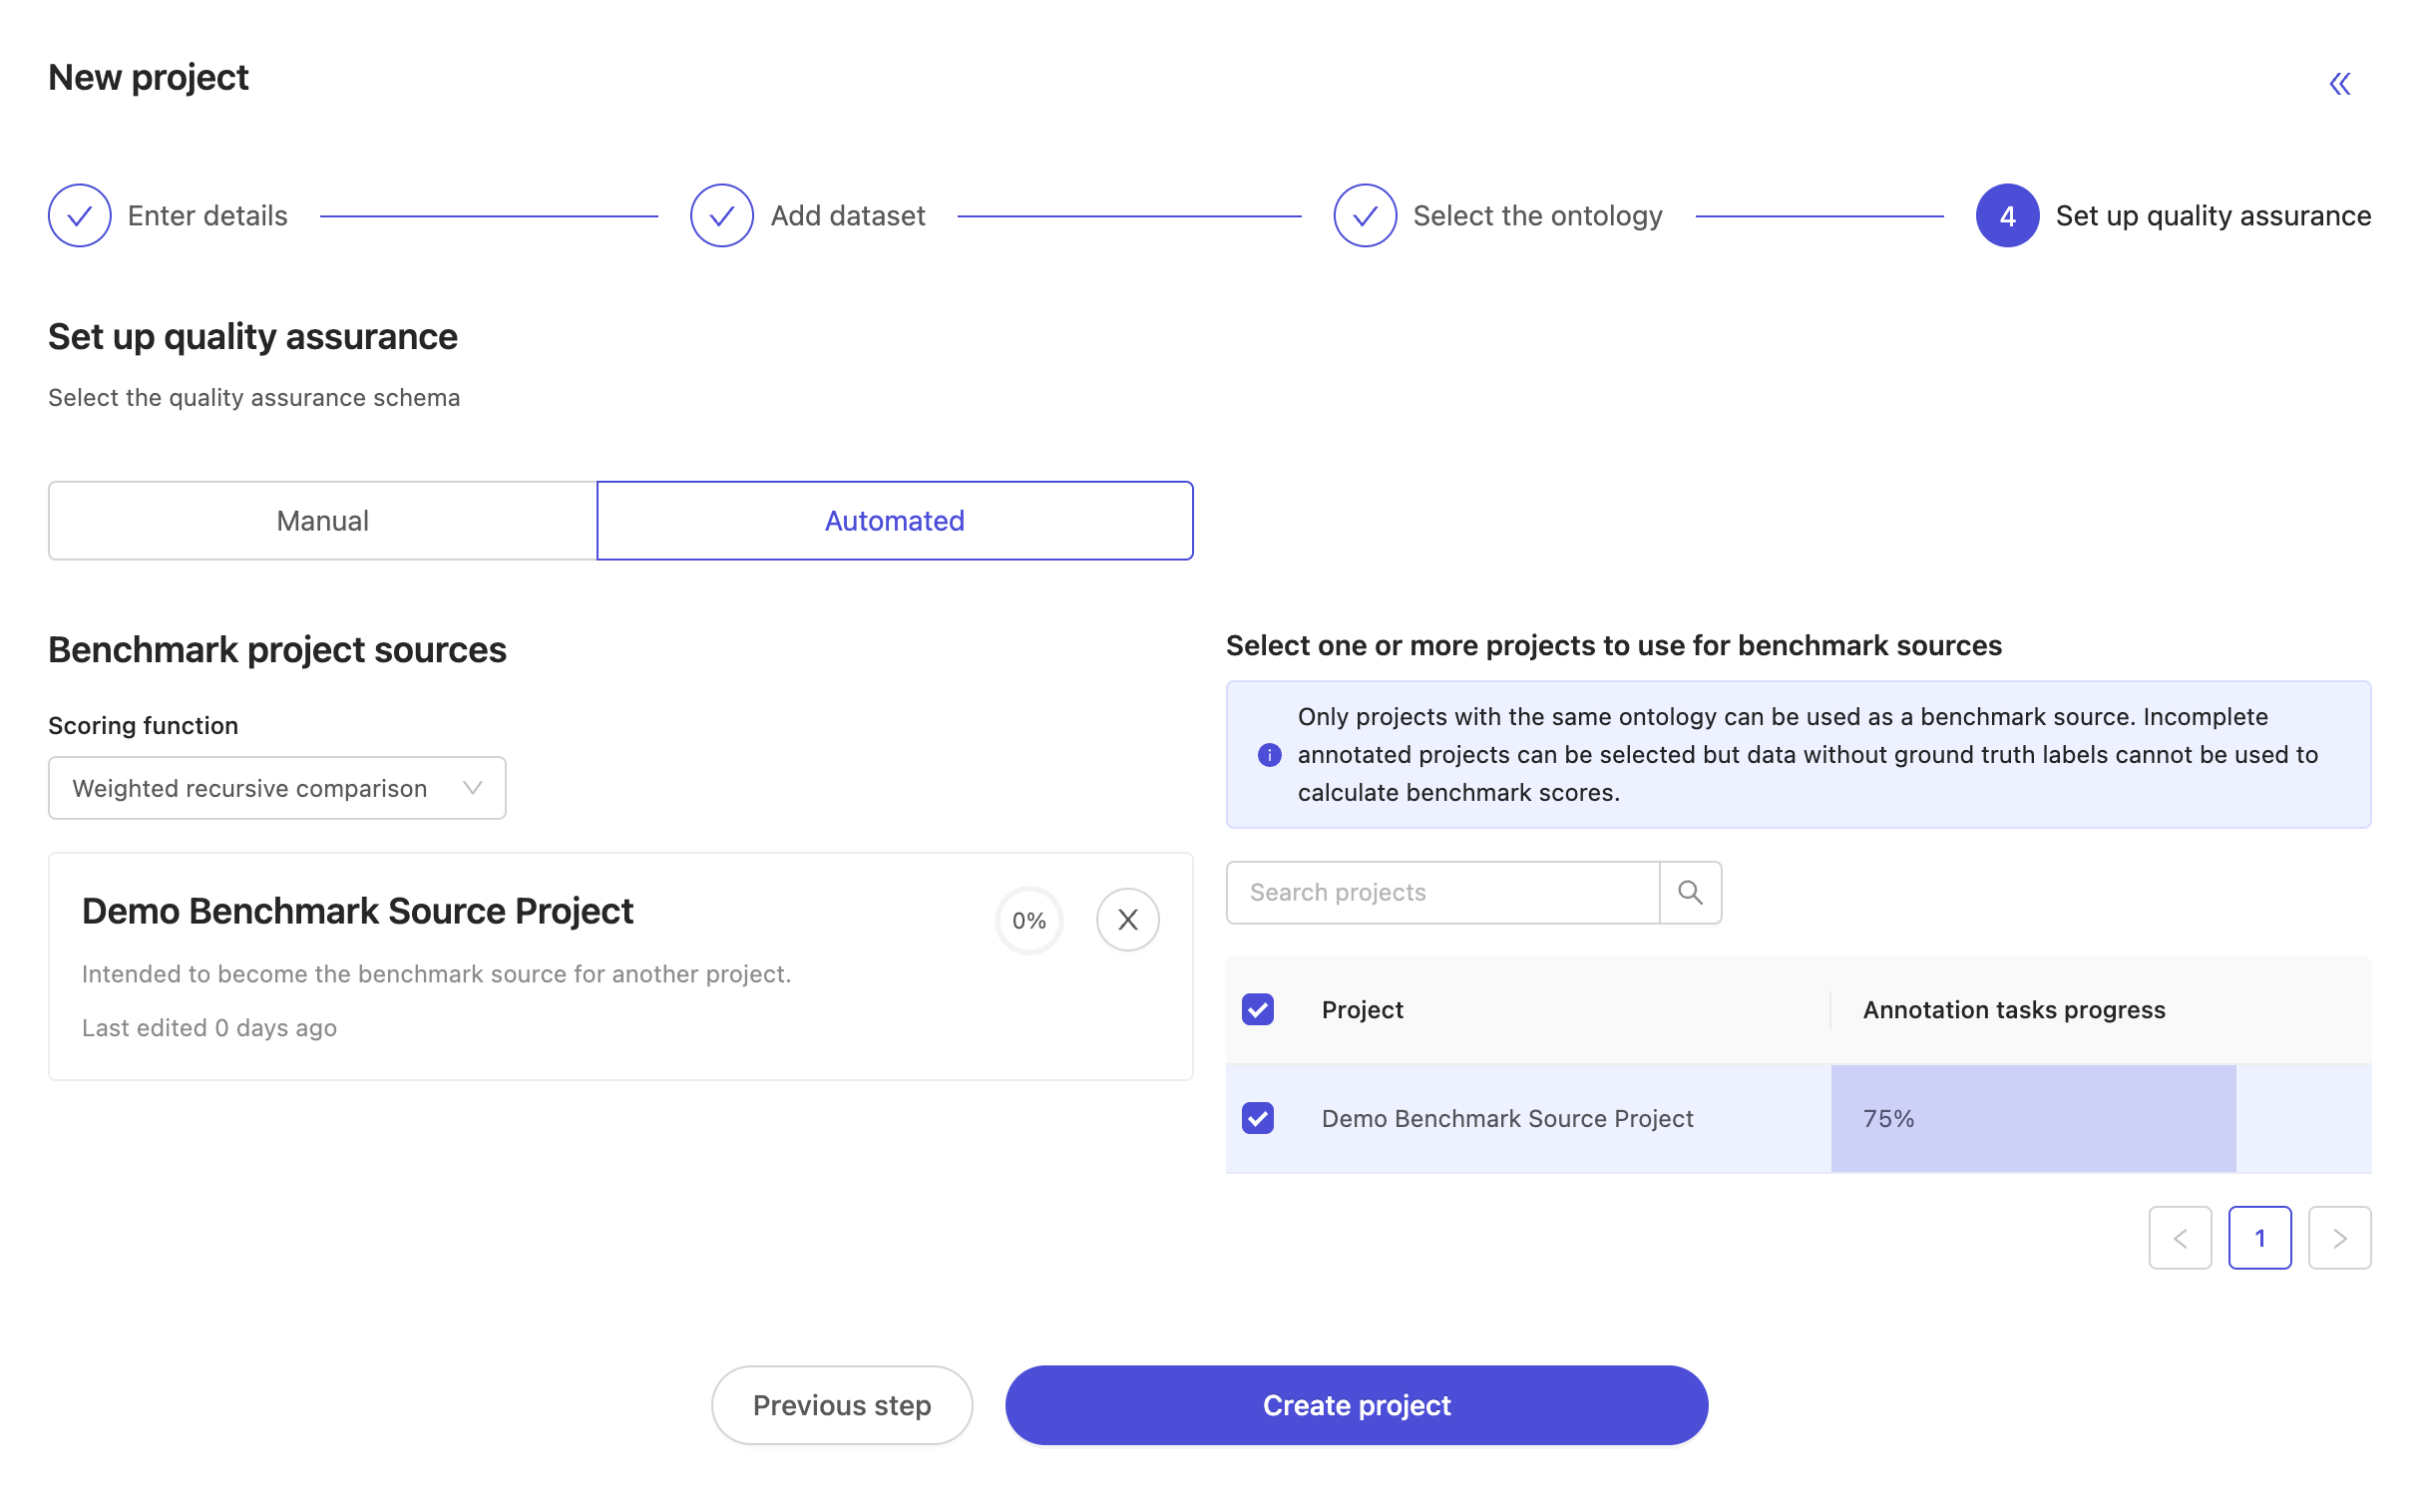
Finally, choose the benchmark scoring function. The current options for benchmark scoring functions are:
- First value of classification: a benchmark function for simple annotation tasks which only involve a single frame classification. For each annotation task, the annotators first created classification instance will be taken as their answer, and compared to the ground-truth labels.
- Weighted recursive comparison: a benchmark function for arbitrarily complex annotation tasks, useful when annotating many objects and classifications, as well as their attributes. By default, all ontology categories and attributes contribute equally to the benchmark score, but it will soon be possible to alter the weight of each attribute in the configuration screen.
Once you've selected your source project(s) and the scoring function, please 'Create project' to finish up! The new benchmark QA project is created and on your project's list.
Using the benchmark QA project
Before any data can be annotated, annotators must first be added to the project. Go the settings tab and add collaborators as your normally do. However, unlike in manual QA projects there is no Reviewer or Annotator & Reviewer role, as there is no manual review work to do!
For each annotator added to the project a copy of the benchmark data will be added to the project. This will result in the total number of tasks increasing. For example, a benchmark project with 8 units of production data tasks, 4 units of benchmark data tasks and 2 annotators will have 16 tasks overall.
As they annotate, they will be shown production data and benchmark data in an alternating fashion, and without notifying the annotator which type of task is which. They are presented at a ratio such that production and benchmark tasks will be finished being annotated at approximately the same time. In the above example with 8 production data units and 4 benchmark data units, annotators are expected to see benchmark data roughly every two production annotation tasks. Keep in mind this ratio may change for individual annotators as they proceed faster or slower through the labeling tasks.
Project dashboard
Selecting a project from the list of annotation projects takes you to its 'Project dashboard'.
This is where you monitor and manage your project. For example, you can view your project's summary statistics, manage labeling tasks, view your team's productivity, train models and invite collaborators.
The dashboard is split into 7 tabs:
- Summary: a high-level view of labeling and productivity statistics.
- Explore: a quick way to explore the distribution of instances and labels across data assets in the project.
- Labels: for managing all the project's labeling activity and tasks.
- Performance: a more detailed view of your team's labeling and productivity.
- Models: for administering models in this project.
- Export: for exporting your labeling data.
- Settings: editing project options, ontology, team collaborators, and other general project settings.
Access to each tab is associated with the various project roles as follows:
| Tab | Annotator | Team Manager | Admin |
|---|---|---|---|
| Summary | ✅ | ✅ | ✅ |
| Explore | ❌ | ✅ | ✅ |
| Labels | ✅ | ✅ | ✅ |
| Performance | ❌ | ✅ | ✅ |
| Models | ❌ | ✅ | ✅ |
| Export | ❌ | ❌ | ✅ |
| Settings | ❌ | ✅ | ✅ |
Summary
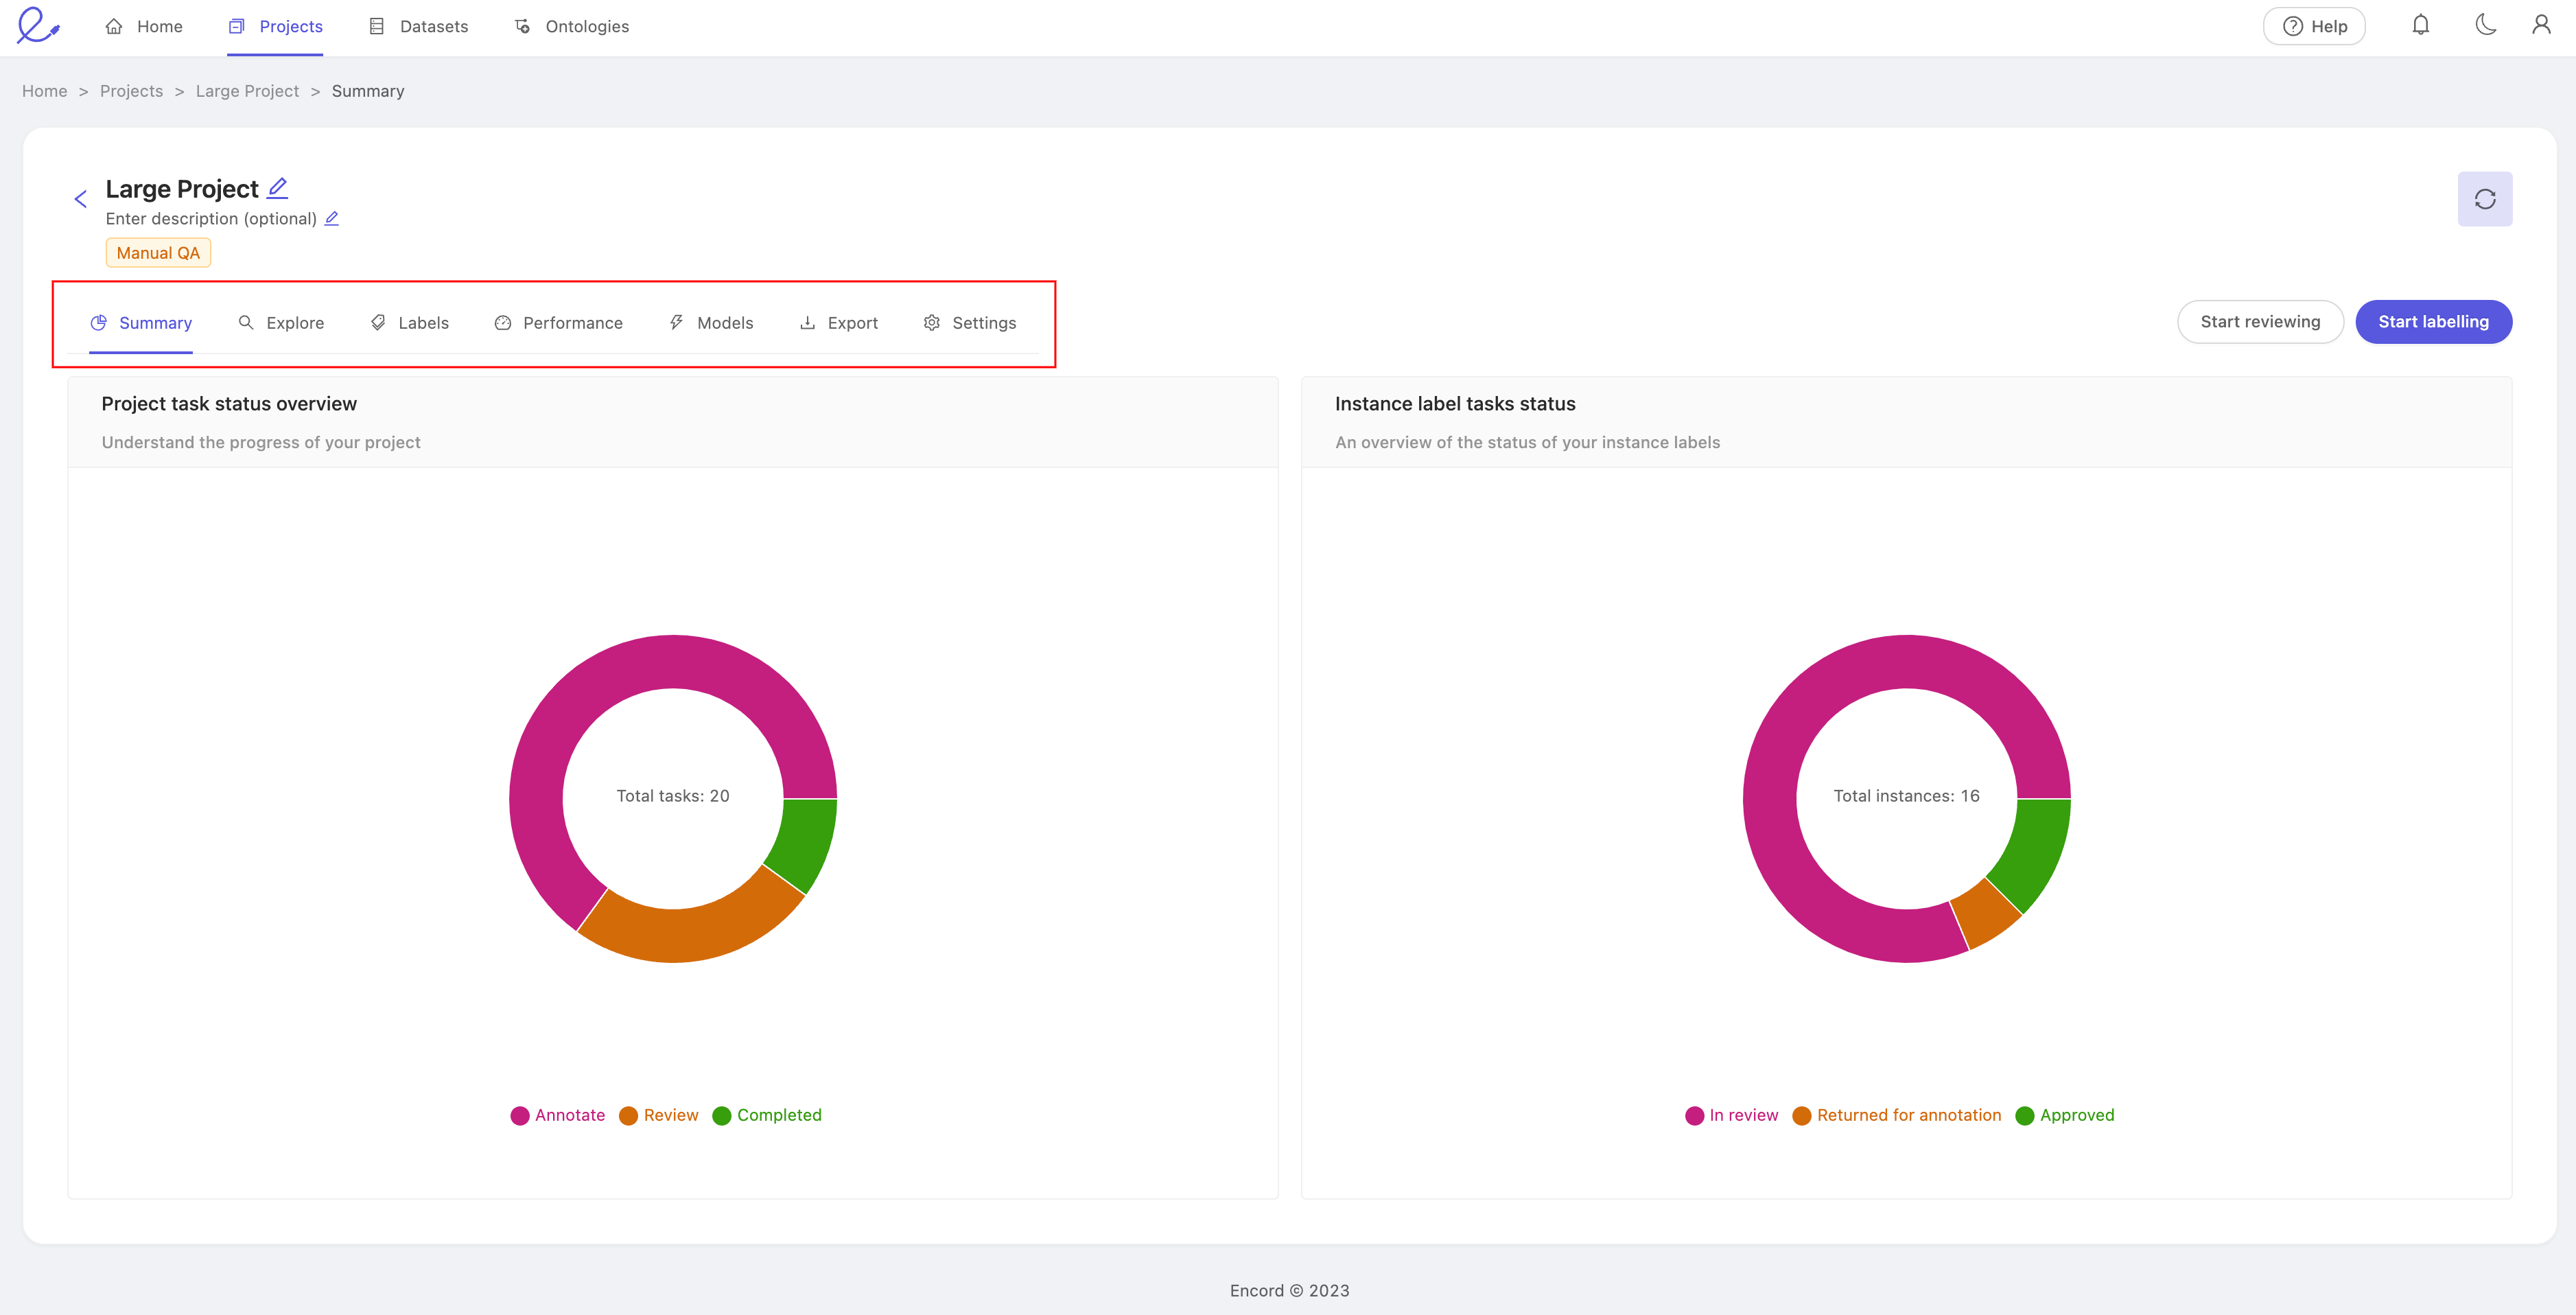
Clicking an annotation project takes you to its Summary dashboard. This dashboard has 2 components and gives you a rich visual display of your project's progress at a high level.
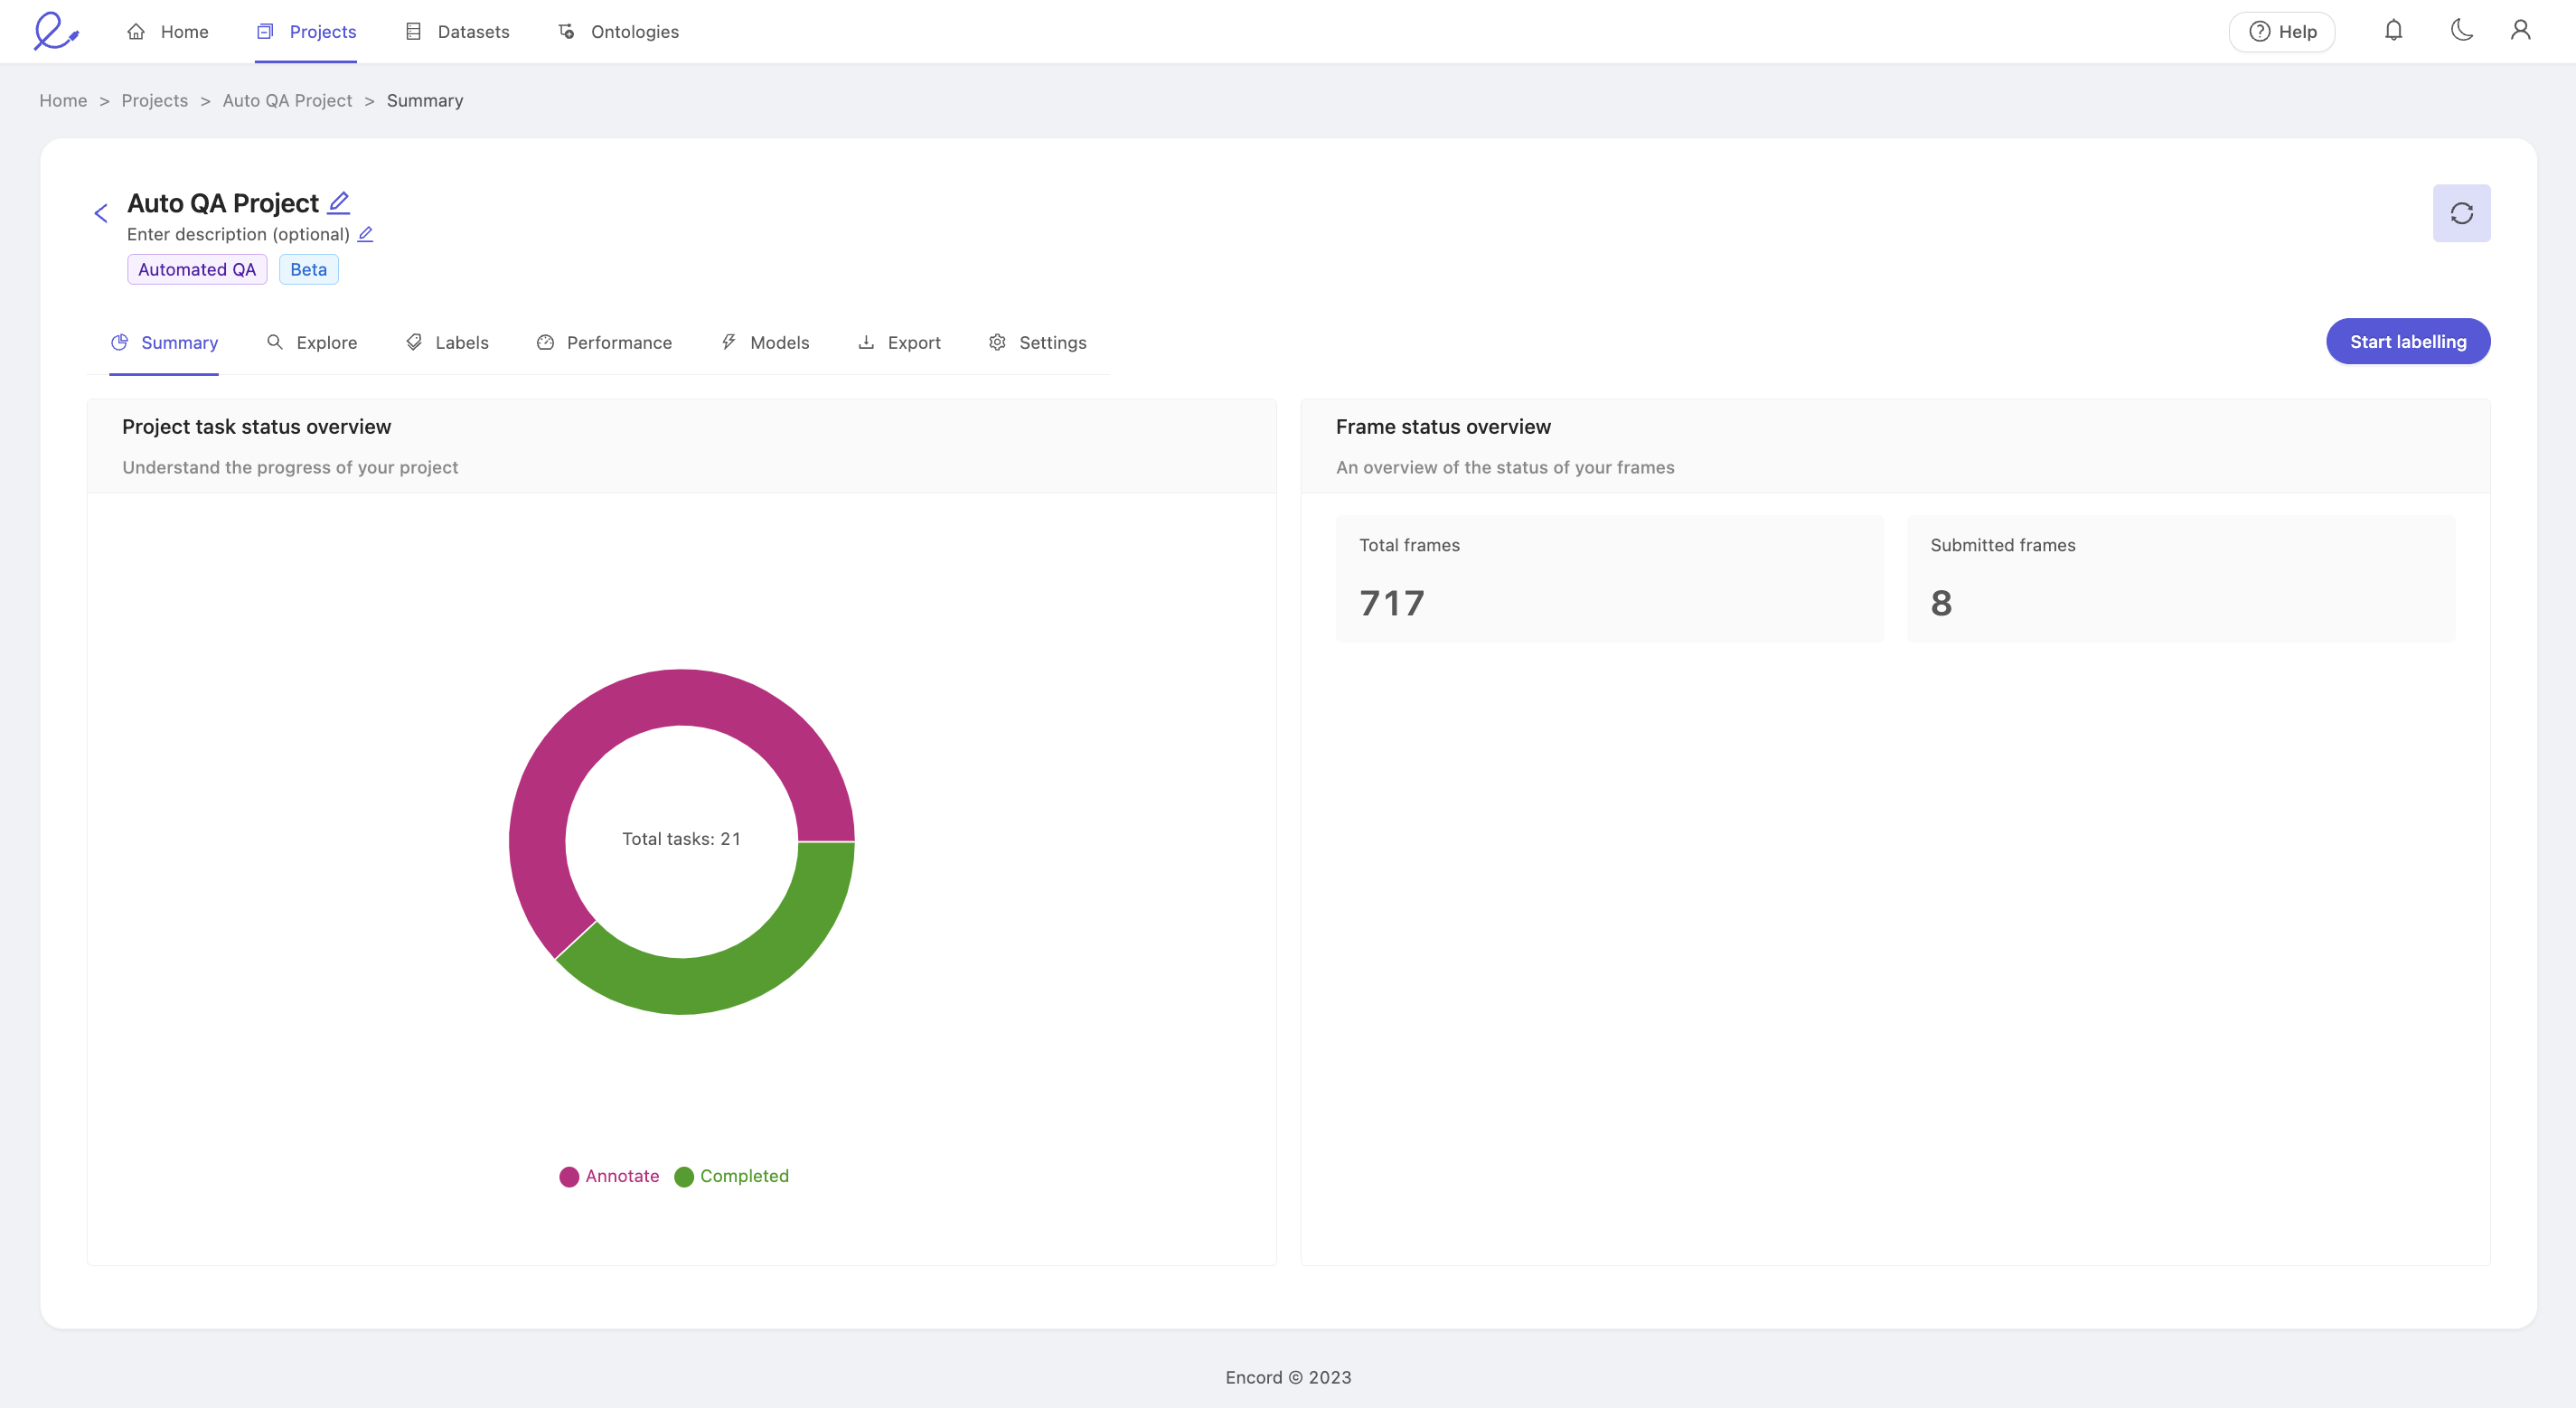
'Project task status overview' displays the number of annotation tasks that are in either the Annotate, or Completed state.
- Annotate: The task is ready to be annotated.
- Completed: The task has been annotated, and automatically reviewed. There is no further action to be taken.
Explore
The Explore page provides interfaces to help you understand how project's annotations are distributed amongst the data assets at both an instance and label level. It allows a deeper exploration through attributes on objects, as well as frame-level classifications.
- Instance statistics: Class distribution across data assets in the given project.
- Label statistics: Label distributions within data assets, objects and classifications.
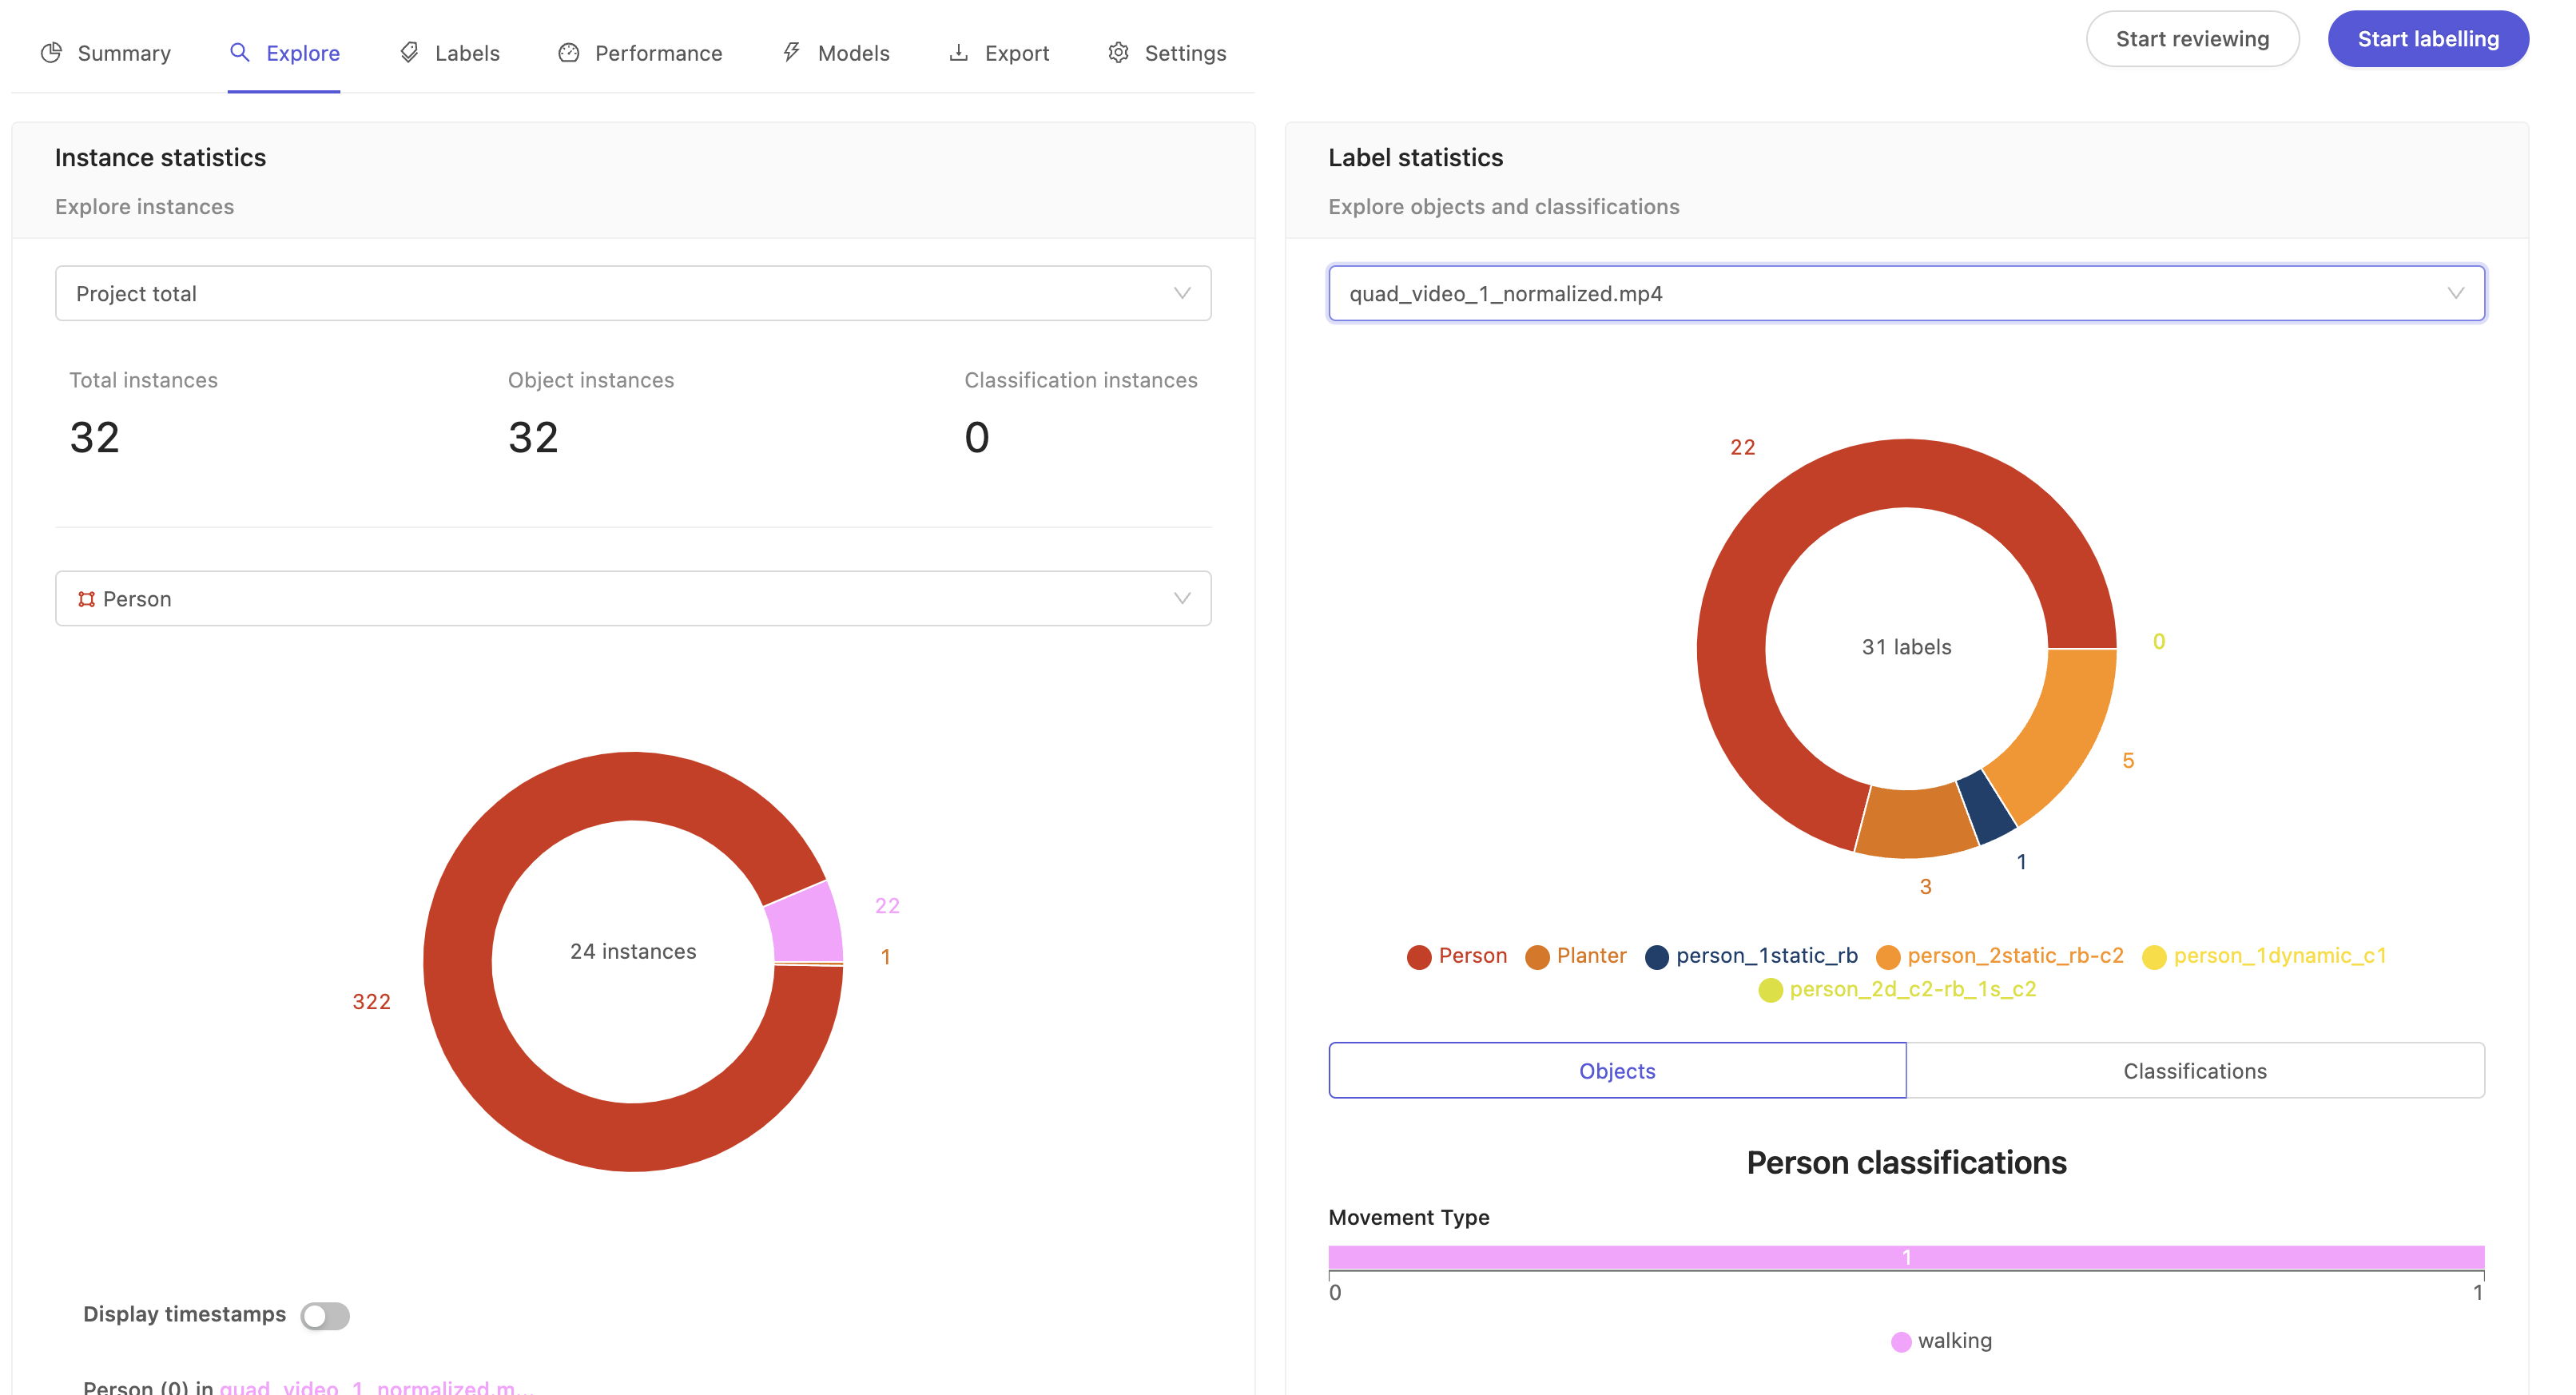
Instance statistics
This section provides the total count of all instances across the datasets in your project.
- Project total: Shows total instances (both objects and classifications) across the project by default. To get instance statistics for individual data files, click the drop-down to select a data file.
- Select class: Shows the total instances for a particular class. This is a summary of how a given class is
distributed across your project's data assets. The pie chart segments show a breakdown of how that class is split across the data assets. - Display timestamps: Flip the toggle to switch between frame numbers and timestamps for the labels.
Label statistics
This is a summary of how your labels are distributed across the project. The pie chart shows a breakdown of how many labels there are for a given class.
- Project total: Shows the total number of labels across different datasets in the project. To get label stats for individual data files, click the drop-down to select a data file.
- Objects: Click on the pie chart segment of a class to see the total number of labels and its attributes (sometimes called nested attributes) if available for that class.
- Classifications: Shows the global classification at project or individual video level. For example, location, time of day, etc.
Quick definitions of classes, instances and labels
- Class: Fundamental unit of the project's ontology. For example the ontology of a project annotating traffic videos could have classes such as Car, Truck, Bicycle, and so on. For more information on objects and classifications, see Ontologies Overview.
- Instance: Specific occurrence of a class. Car(0) is an instance of the Car class, for example, it could be a specific black sedan. The single Car(0) instance can appear in a single frame or a range of frames. Therefore, instances may contain multiple labels across frames.
- Label: An frame-specific annotation of an instance. For example the annotation of Car(0) on frame 201 is a label.
Labels
The Labels page is your gateway to creating labels in your project. Access to each pane will depend on the user's project role. We briefly summarize the purpose of each tab, and the roles which can access each below.
| Role | Activity | Queue | Data | Instances |
|---|---|---|---|---|
| Annotator | ✅ | ✅ | ❌ | ❌ |
| Team Manager | ✅ | ✅ | ✅ | ✅ |
| Admin | ✅ | ✅ | ✅ | ✅ |
The labels dashboard features the following tabs:
- Activity: View all Completed tasks, and confirm the status of labels within tasks by clicking View.
- Queue: The Queue tab is where all labeling actions are initiated, regardless of a user's role within the project.
- Data: Use the Data tab to get an overview of every data asset in the project, regardless of status.
- Instances: The Instances tab lets you use the unique instance identifier to search the project for a specific instance, and jump directly into the editor to confirm the status of an annotation visually.
Activity
The Activity tab allows you to quickly monitor annotation activity in your project by showing tasks and providing a summary interface.
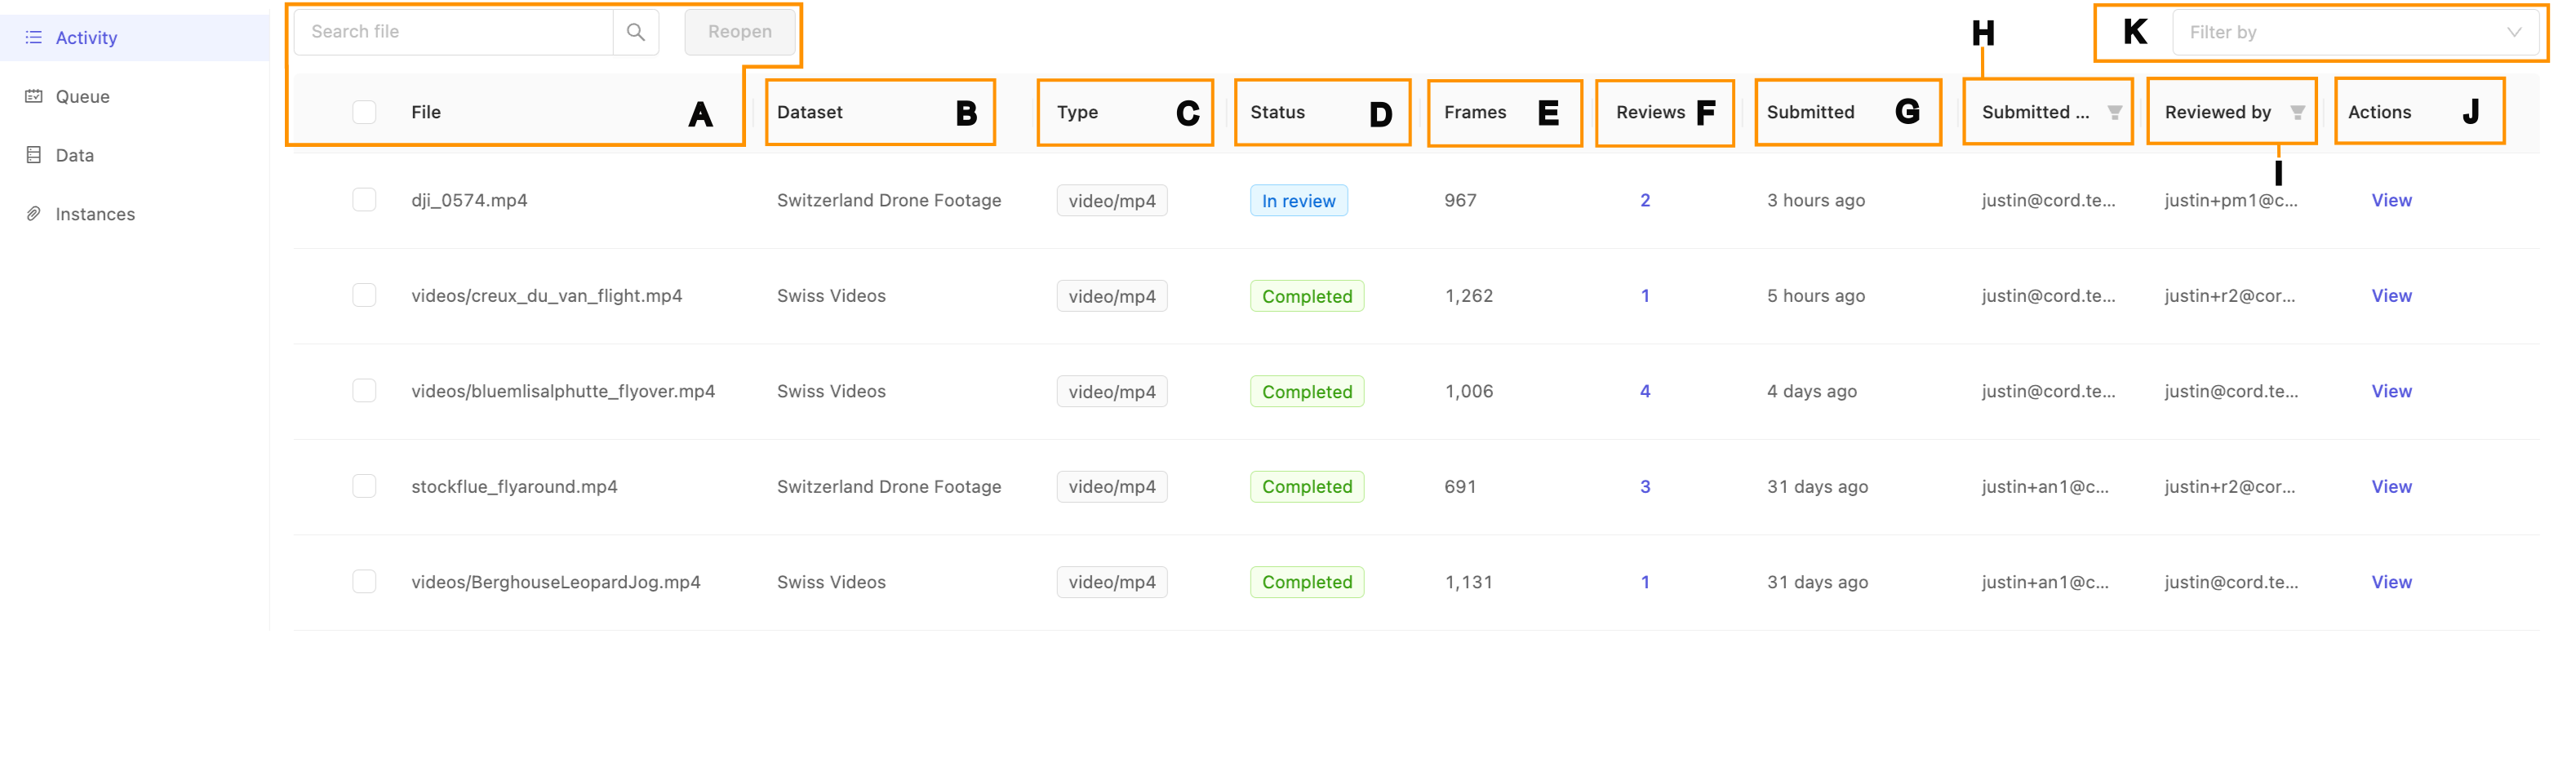
- File, Search, & Reopen: The name of the specific data unit or data asset. This is the same as the name in the dataset to which this data asset is a part of. Use the search box to filter the list by file name, and send tasks back to annotation using the 'Reopen' feature.
- Dataset: The dataset the data asset belongs to.
- Type: The type of the data, such as an image or video. For more on our supported data types, see our supported data documentation.
- Status: The status of this task.
- Frames: The number of frames in the data asset. For a DICOM series, this will be the number of slices.
- Submitted: Indicates when the last submit action, whether for an annotation was made against any of the labels in this data asset.
- Submitted by: Who last submitted the annotations.
- Actions: Click the View link to open the label editor. Note: this feature is only available to Team Managers and Administrators as an extra method of submissions. We advise extra caution if you decide to edit the labels from this interface. If significant work needs to be done, we strongly recommend to 'Reopen' the task to prevent possible errors from simultaneous edits.
- Filter: Use the filter drop-down to only show tasks with the selected status. Only filtered results will be shown in the Label Editor.
File, Search, and Reopen
The file column shows the name of the data asset. For files uploaded via the GUI, they keep the name they were uploaded with. For files added from your cloud storage, this will normally be the path under the bucket they are stored on.
Use the search interface to quickly filter and display only those tasks with file names matching your desired text. Even partial matches will be shown. For example: searching "fly" will return file names containing "flyover" and "flyaround."
The Reopen button allows Administrators and Team Managers to send tasks which are currently Completed back to the annotation stage. Select your target tasks using the checkboxes in the File column to select individual assets, or select the checkbox in the column header to select all tasks, and press the Reopen button to move all selected tasks back to the annotation stage. Tasks reopened in this way will have the status Returned in the Queue tab. No labels are lost by reopening a task. The 'Reopen' action is only applied to tasks which are both visible (i.e. not filtered out by the file search) and selected.
Status
This column shows the status of this task. The Activity pane only shows assets which have had some action done on them, and therefore only reflects Completed tasks.
For a comprehensive summary of the possible task states, see the status section of the Data tab, below.
Queue
The Queue tab is where annotators look to find their next task. The Start labeling button visible throughout the project open the label editor with the next task in the queue according to the relevant task type.
The Queue tab can be used to assess the number of tasks assigned to you as an annotator and therefore estimate your likely workload. Administrators and Team Managers can also use it to quickly verify the current assignments per team member, and change assignments as necessary.
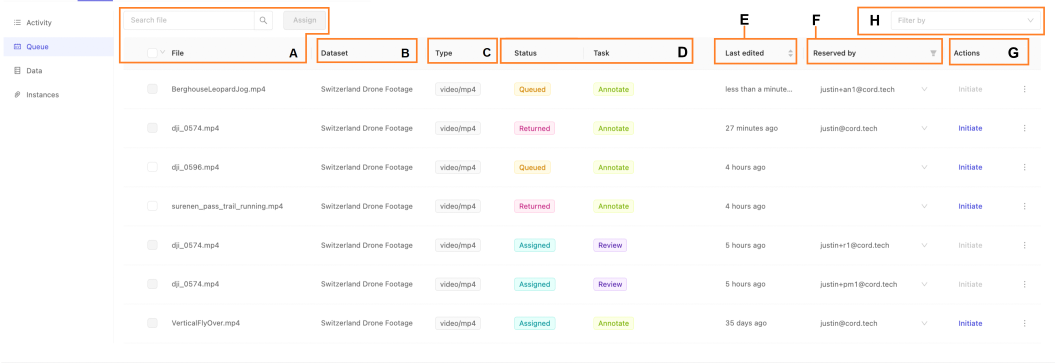
- A. File, Search, & Assign: The name of the specific data unit or data asset. This is the same as the name in the dataset to which this data asset is a part of. Use the search box to filter the list by file name, and send tasks back to annotation using the 'Reopen' feature.
- B. Dataset: The dataset the data asset belongs to.
- C. Type: The type of the data, such as an image or video. For more on our supported data types, see our documentation here.
- D. Status and Task: The status and category of this task.
- E. Last Edited: When the task was last edited
- F. Reserved by: Who the task has been assigned to or reserved by
- G. Actions: Depending on your collaborator role, you can initiate or reassign the task.
- H. Filter: Use the filter drop-down to only show tasks of the selected status. Only filtered results will be shown in the Label Editor.
File, Search, and Assign
The file column shows the name of the data asset. For files uploaded via the GUI, they keep the name they were uploaded with. For files added from your cloud storage, this will normally be the path under the bucket they are stored on.
Use the search interface to quickly filter and display only those tasks with file names matching your desired text. Even partial matches will be shown. For example: searching "fly" will return file names containing "flyover" and "flyaround."
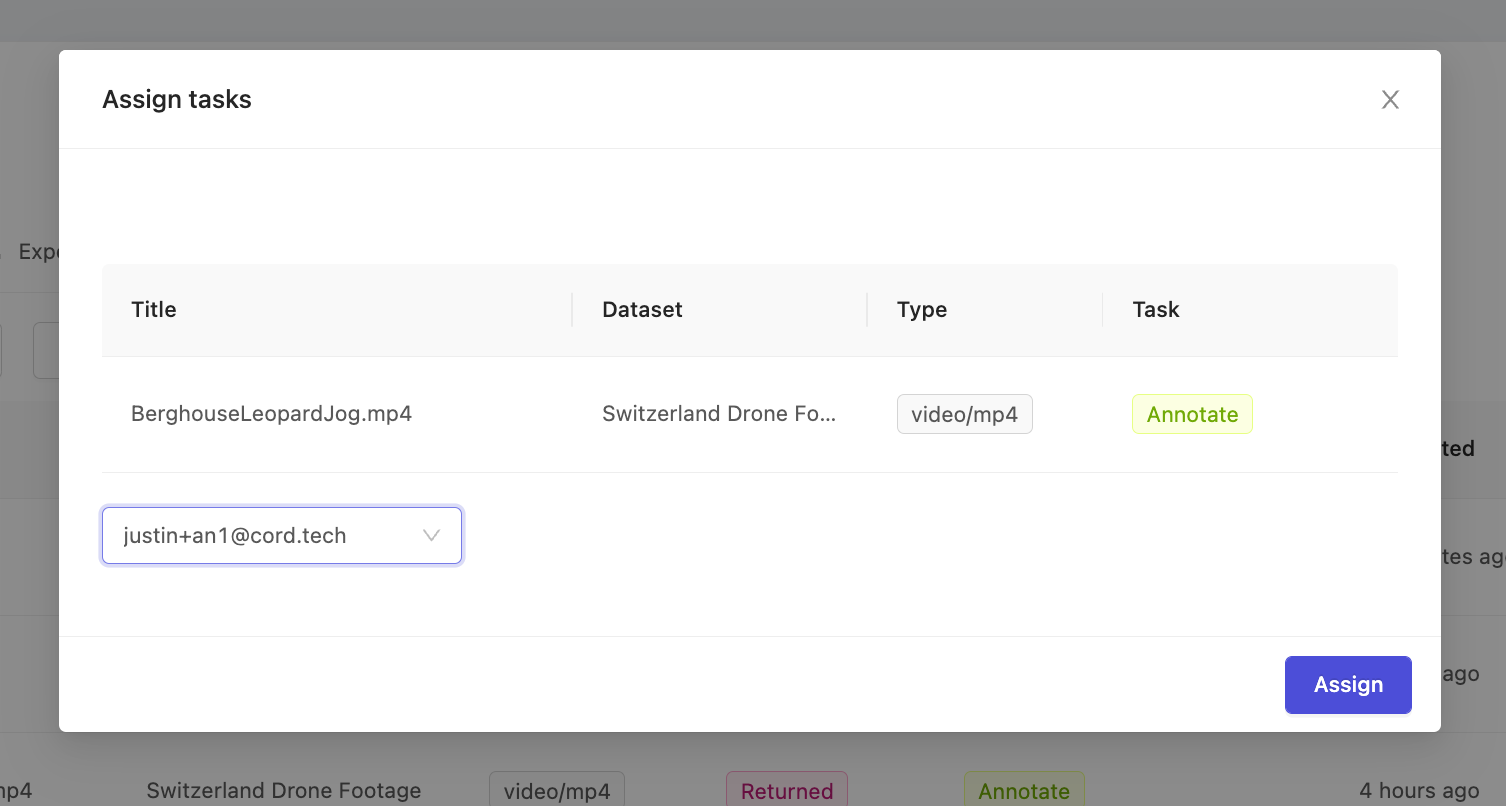
The 'Assign' button allows Administrators and Team Managers to allocate unassigned tasks to specific collaborators for annotation. Select your target tasks using the checkboxes in the File column to select individual assets, or select the checkbox in the column header to select all tasks, and press the 'Assign' button open the task assignment popup.
Confirm the selected tasks are as intended, then select the target collaborator from the drop-down and press assign. Tasks which have already been assigned to another collaborator, as indicated by the email in the 'Reserved by' column, can not be reassigned until they have first been released.
Status and Task
The Queue tab only shows tasks which have remaining annotation work to be done. Therefore, the stage of the task within the TMS is understood by reading the Status and Task columns together.
Benchmark QA projects contain only annotation tasks. Therefore, only tasks with the status Queued will be represented. Queued tasks are ready for annotation. For an annotation tasks to be Queued it must not be assigned to a user, and must have no submitted labels. It may have been previously assigned to a user, but subsequently released before any annotations were submitted.
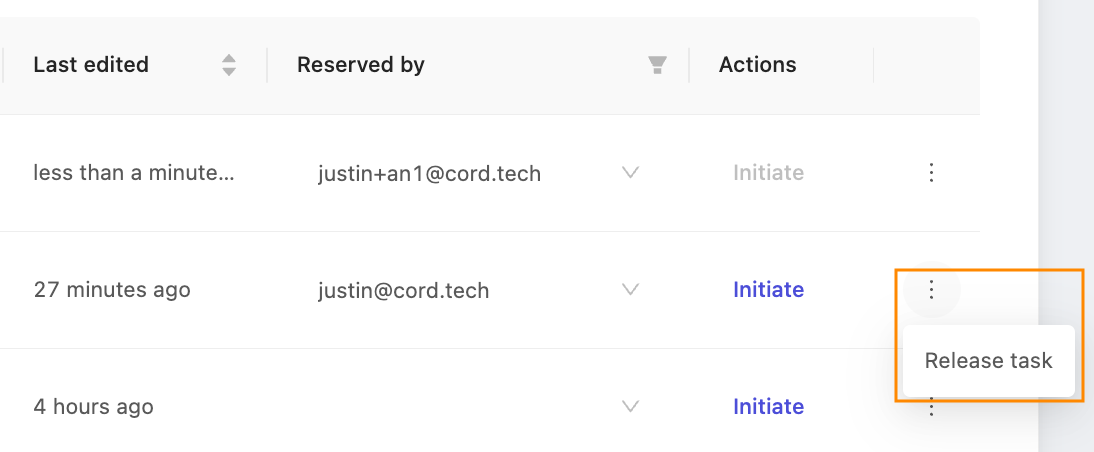
Actions
There are two relevant actions that can be done on each task from the Queue tab. Press 'Initiate' to open the label editor and proceed with annotation, depending on the task type.
Additionally, Administrators and Team Managers can click the three vertical dots to open the expanded menu, to access the 'Release task' function. Tasks must be explicitly released before they can be reassigned.
Data
The Data tab gives a complete overview of all the data asset tasks in the project, regardless of their progress. Therefore, this is the first place Administrators and Team Managers should check if they want to confirm the status of a given task.
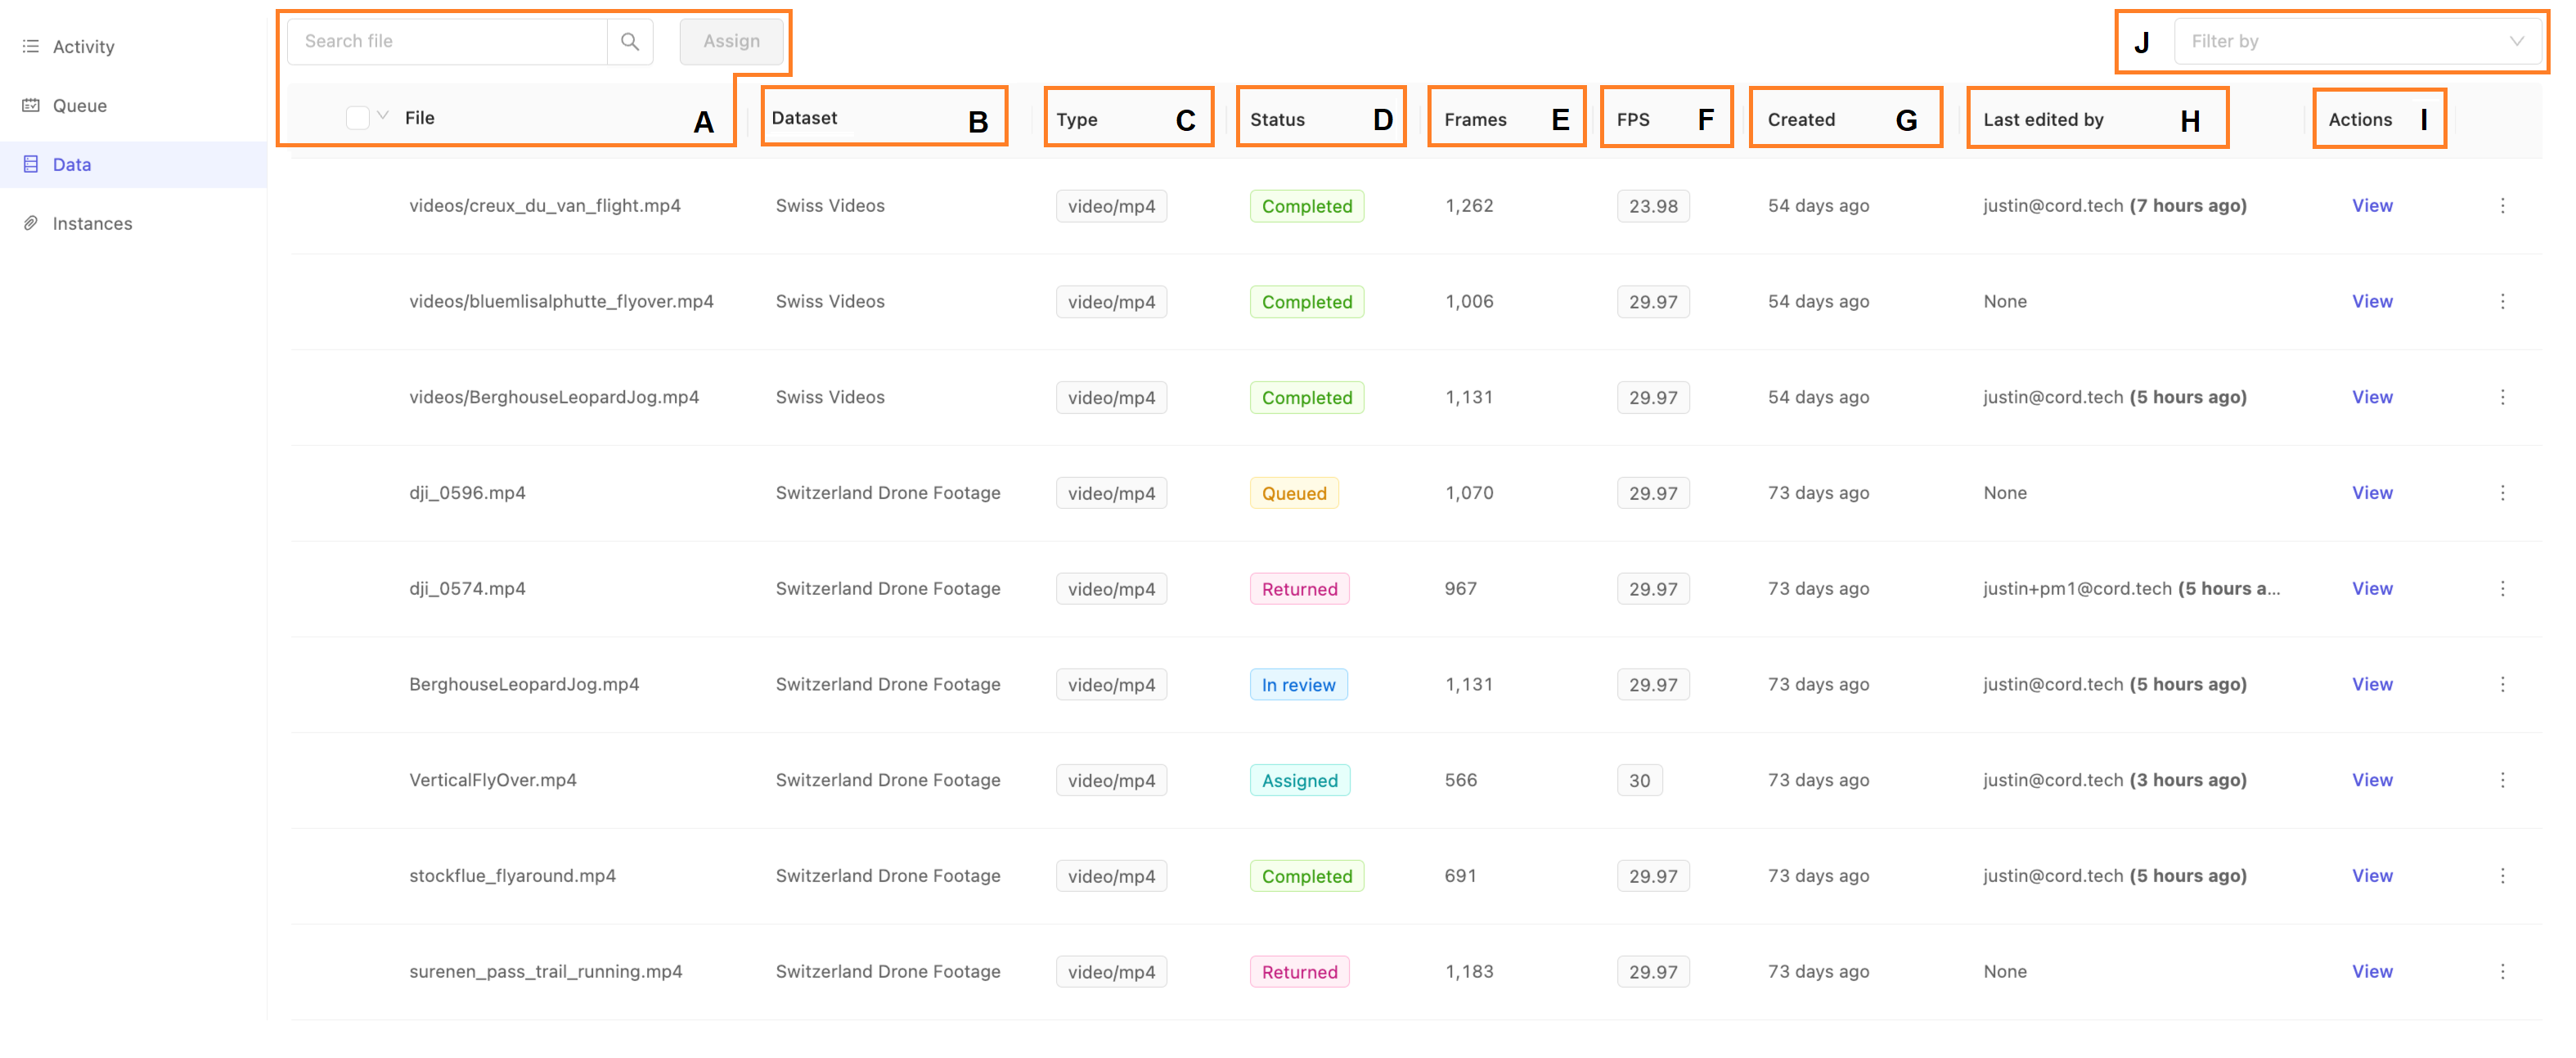
- A. File & Search: The name of the specific data unit or data asset. This is the same as the name in the dataset to which this data asset is a part of. Use the search box to filter the list by file name.
- B. Dataset: The dataset the data asset belongs to.
- C. Type: The type of the data, such as an image or video. For more on our supported data types, see our documentation here for more details.
- D. Status: The status of this task.
- E. Frames: The total frames in this data asset. This will apply to videos, image sequences and DICOM. Images always only have 1 frame.
- F. FPS: the frames per second of the data asset. This only applies for data of type video. Others will show a dash (
-). - G. Created: When the task was created. Tasks are created when the dataset containing the data asset is attached to the project.
- H. Last edited by: the last collaborator to edit the task in any capacity, and when.
- I. Actions: The Data page allows users to view the task in the label editor, as well as get a code snippet for using the SDK with this task, and confirming the edit actions via the Activity Log.
- J. Filter by: Use the filter drop-down to view only tasks with the selected Status.
Tip
Confused about the difference between image groups and image sequences? See our documentation here to learn about different data types in Encord.
File and Search
The file column shows the name of the data asset. For files uploaded via the GUI, they keep the name they were uploaded with. For files added from your cloud storage, this will normally be the path under the bucket they are stored on.
Use the search interface to quickly filter and display only those tasks with file names matching your desired text. Even partial matches will be shown. For example: searching "fly" will return file names containing "flyover" and "flyaround."
Status
The data tab provides the most comprehensive overview of all the tasks associated with each data asset in a given project. As such, this is the first place to check to see the status of various tasks.
- Queued: The task is ready for annotation. For a task to be 'Queued' it must not be assigned to a user, and have no submitted labels. A queued task may have been previously assigned to a user, but subsequently released before any annotations were submitted. Queued tasks are shown in light orange.
- Assigned: An annotation task has been assigned to a specific user. Assigned tasks are shown in aqua green.
- Completed: The annotation task has been submitted and completed. Completed task status is shown in green.
Actions
Clicking View will drop you into the label editor to do a live audit of the annotations in this data asset. The Data tab is only visible to Administrators and Team Managers and so grants great power to view any data asset. Encord advises edit actions are NOT taken from the Data tab unless you have received confirmation no one else is concurrently editing the asset.
Caution
In order to prevent any possible issues of annotator work being overwritten, it's critical that all annotations are done via the Queue tab, and only the person assigned to the task makes annotations at any given time.
Other possible actions include 'API Details' which show a popup with sample code you can use to get started with our SDK to access this particular data asset, often known as a label row in the SDK. Click 'Activity log' to see a popup with a graphical summary of add / edit / delete actions on this data asset indexed by annotator or ontology class. Click 'Display logs' in the lower right to show all actions in reverse chronological order.
Instances
The Instances tab allows Administrators and Team Managers to search within the data to directly find specific instances. Recall that an annotation instance correlates to a unique instantiation of a specific ontology class in a data asset.
For example, if you have the 'Person' class in your ontology, the first instance of a 'Person' in a given data asset will be indicated in the interface as 'Person (0)', the second as 'Person (1)' and so on. Instances, therefore, can exist in multiple frames of a data asset, and indicate the same object. Use the Instances tab to search for specific instances of objects or classifications using their Identifier.
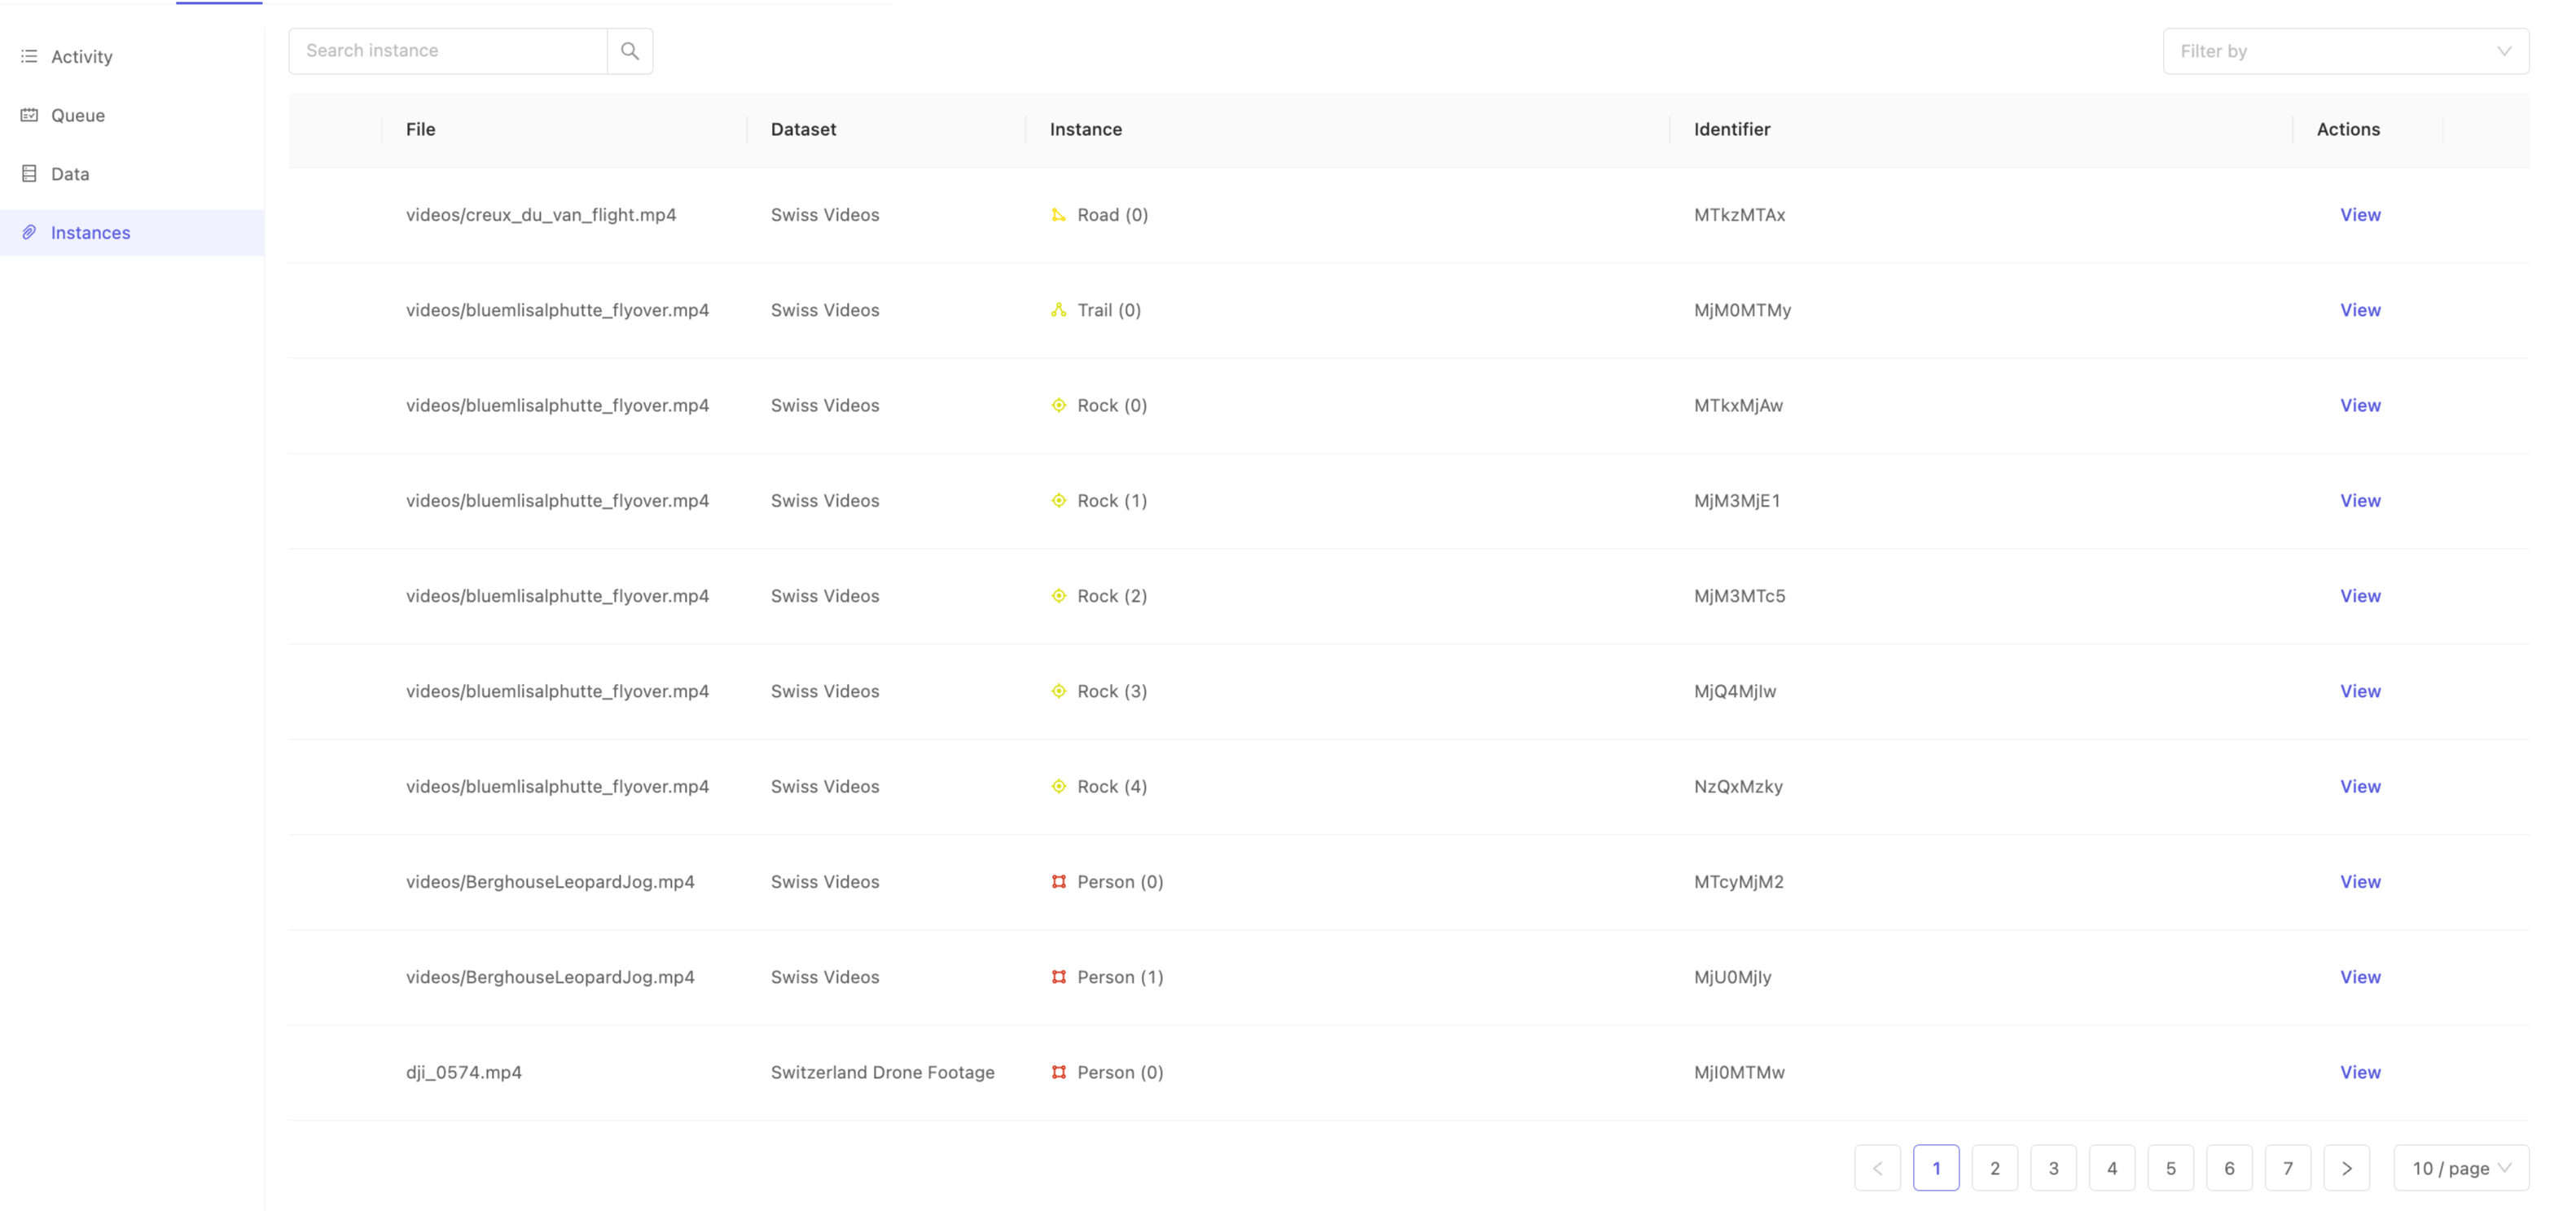
Instance identifiers are unique at the project scope, and can be found in any of the following ways:
- From inside the label editor, by clicking on a particular instance, and then selecting 'Copy identifier' from the instance action menu.
- From inside exported labels, where they are known as the
objectHashorclassificationHashas appropriate. - When uploading labels using the SDK, you may specify your own
objectHashorclassificationHash.
Once you have an identifier of interest, use the 'Search instance' interface to filter the instances by identifier to quickly find the instance you're interested in. This can be particularly handy when you want to visually confirm an annotation you may not have seen before, but for which you have the identifier.
After locating your instance of interest, click View from the 'Actions' column to jump deeply into the dataset straight to where the instance is first annotated.
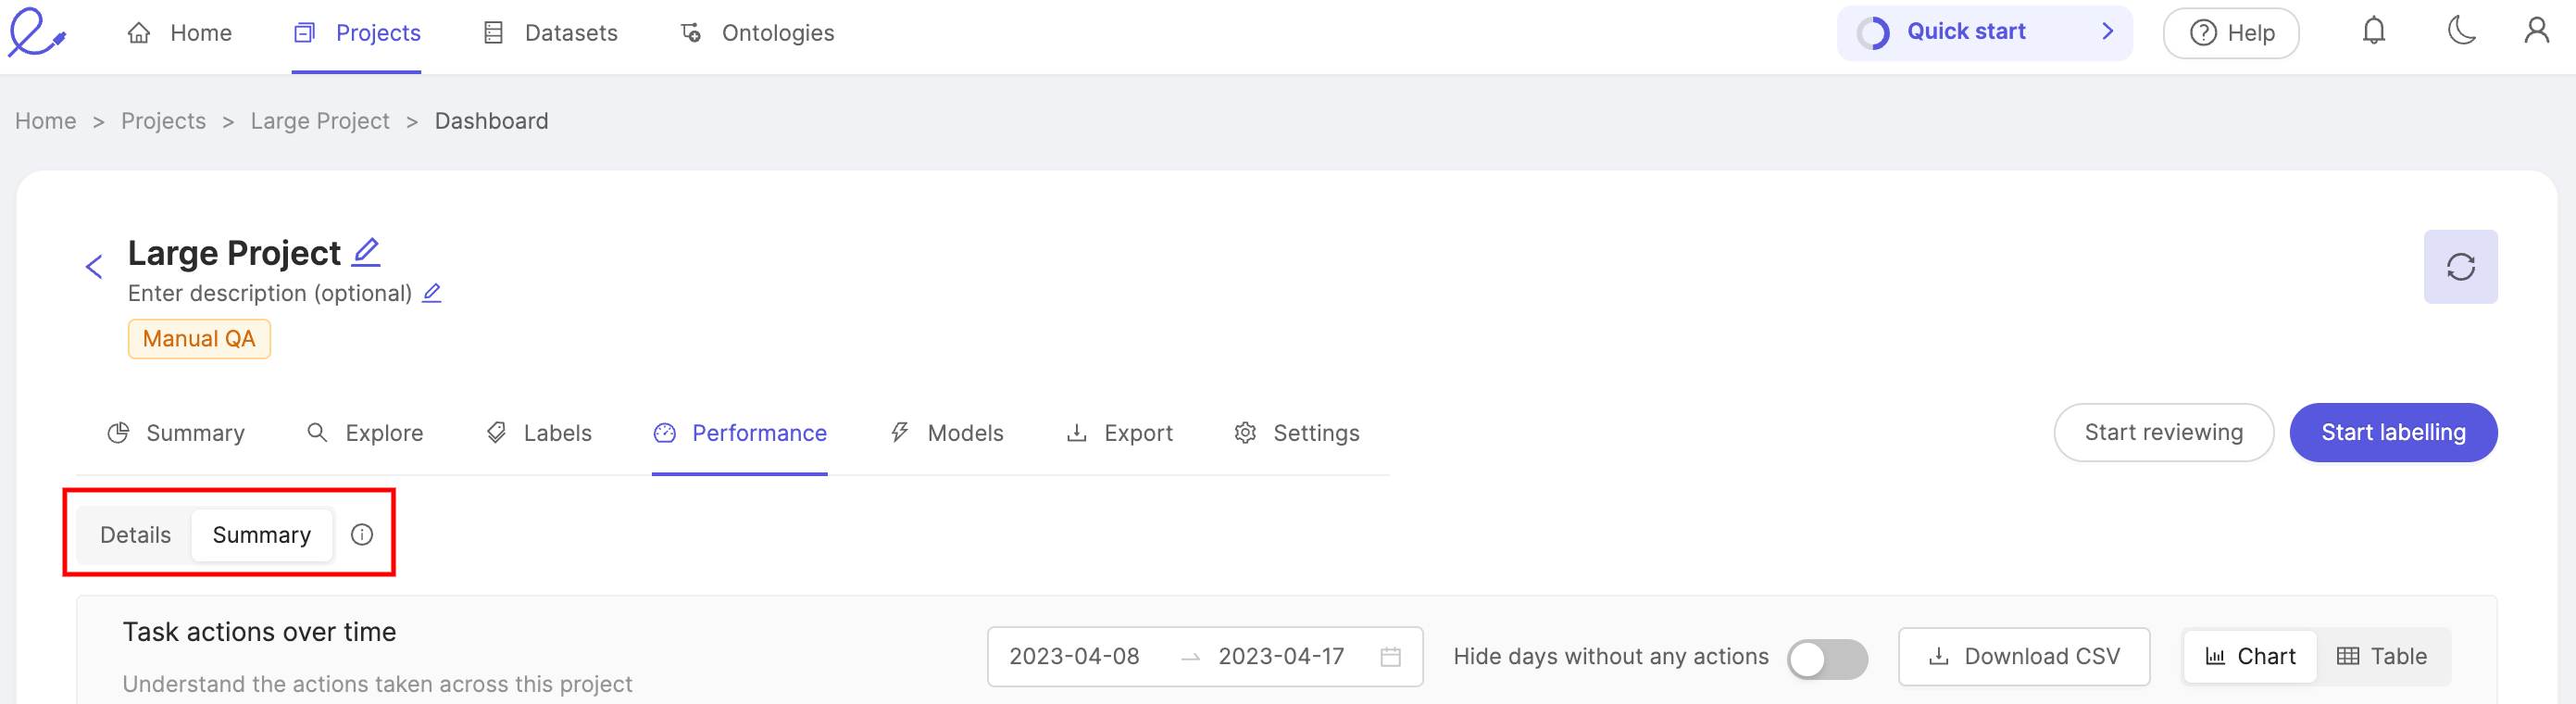
Performance
Switch between a summary, or detailed view of the Performance page to different metrics relating to your team's performance.
Performance - Summary
The Summary tab of the performance dashboard provides an overview of your team's manual labeling and productivity.
Caution
The Summary tab only displays actions taken in the Label Editor. Actions taken in the SDK will not be displayed.
Task actions over time
View the number of tasks in a project that have been approved, rejected, and submitted for review over a given period of time.
- The height of a bar represents the total number of tasks.
- The height of each color within a bar represents the number of approved, rejected, and submitted tasks.
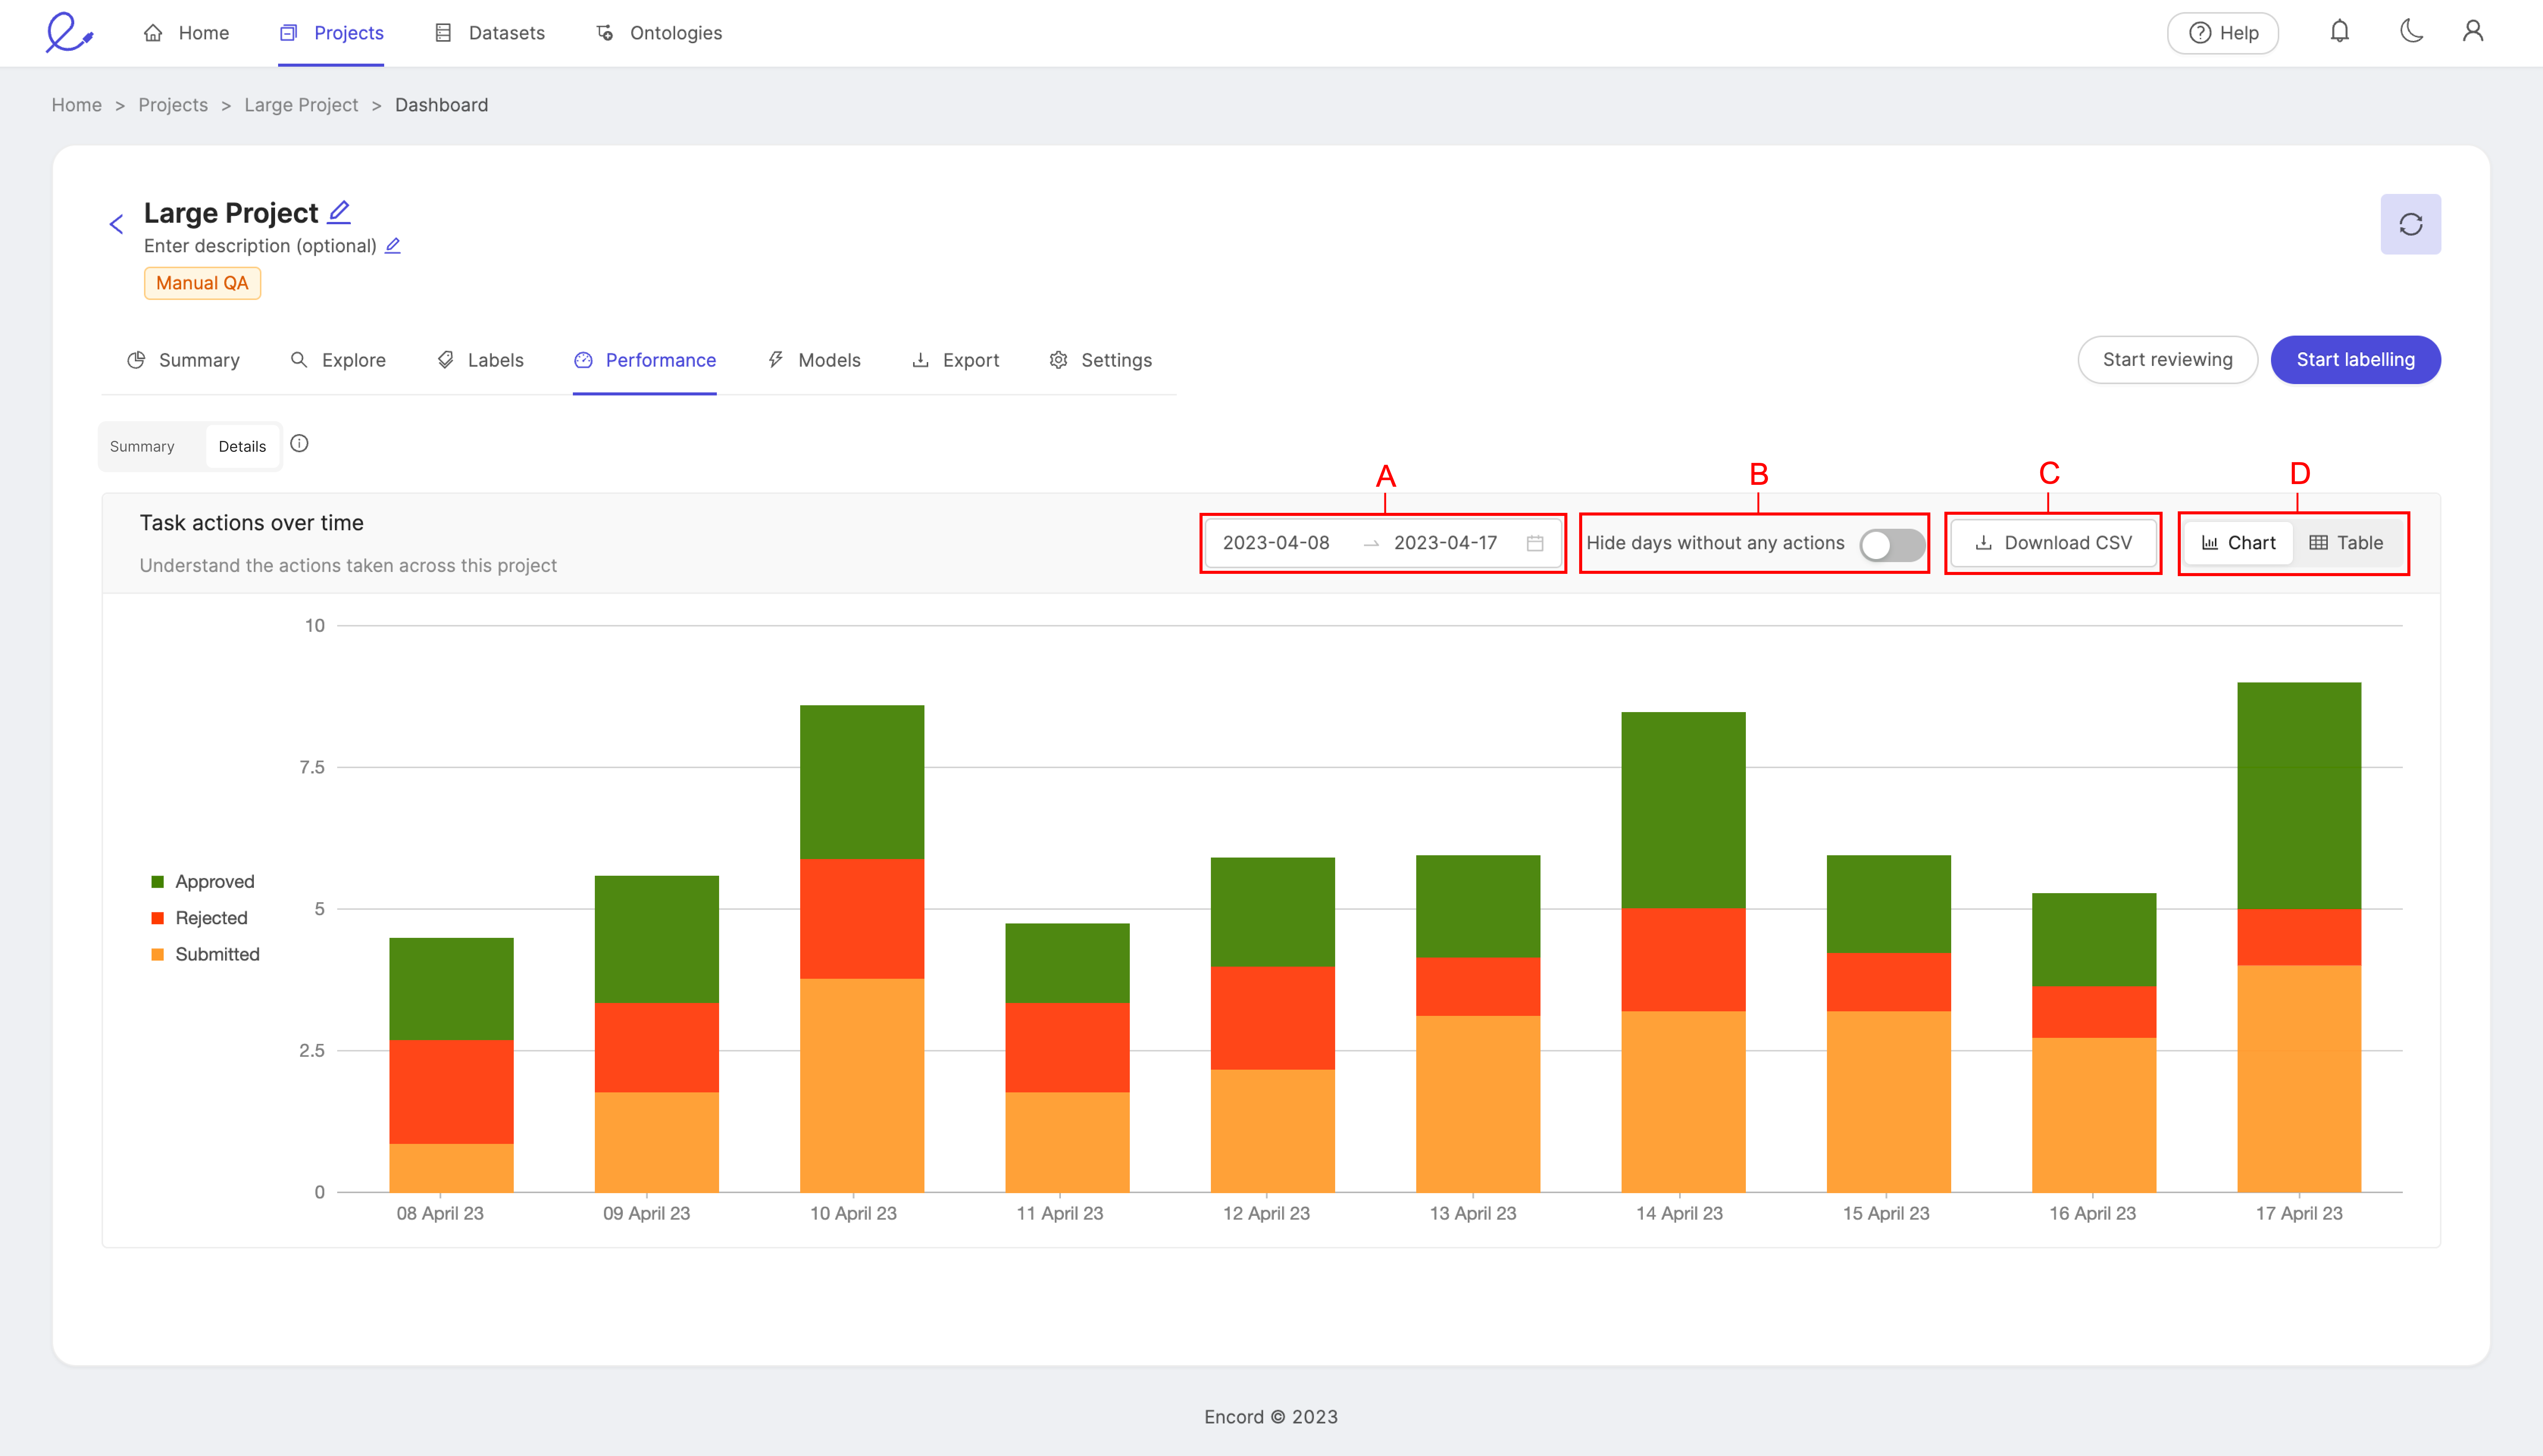
- A: Set the time period you would like to see displayed by selecting a range of dates.
- B: The Hide days without any actions toggle removes all days at which no actions were taken from the view.
- C: Download a CSV file of the data.
- D: Display the data as a bar chart, or a table. While the chart provides a clear visual representation, the table provides exact figures for a more detailed picture of your team's performance.
Instance Label actions over time
View the number of instance label actions in a project that have been approved, rejected, and submitted for review over a given period of time.
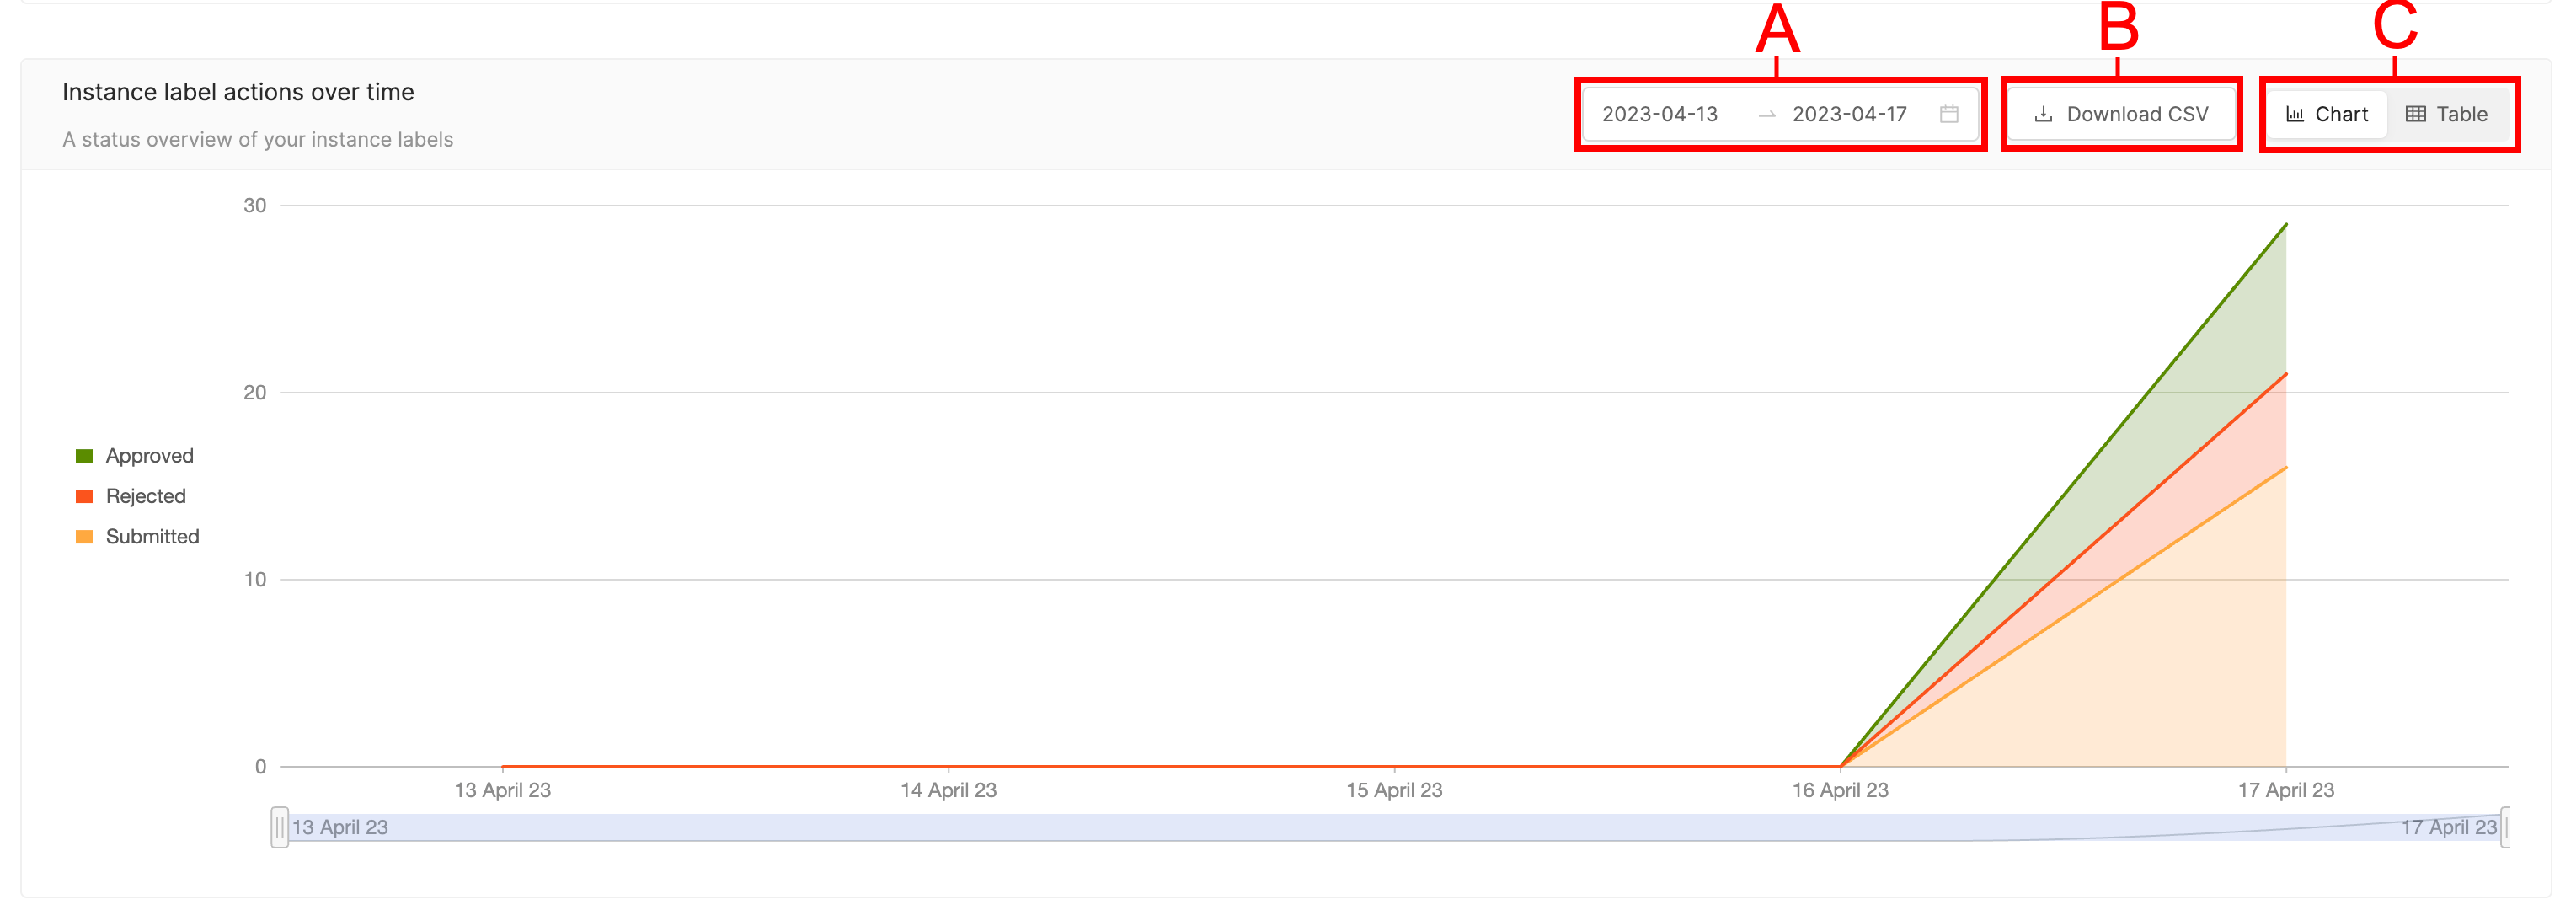
- A: Set the time period you would like to see displayed by selecting a range of dates.
- B: Download a CSV file of the data.
- C: Display the data as a bar chart, or a table. While the chart provides a clear visual representation, the table provides exact figures for a more detailed picture of your team's performance.
Within your specified time period, you can choose which dates to display by using the slider located beneath the graph.
Team collaborators
The 'Team collaborators' section shows the duration of time each project collaborator spend working on a given file.
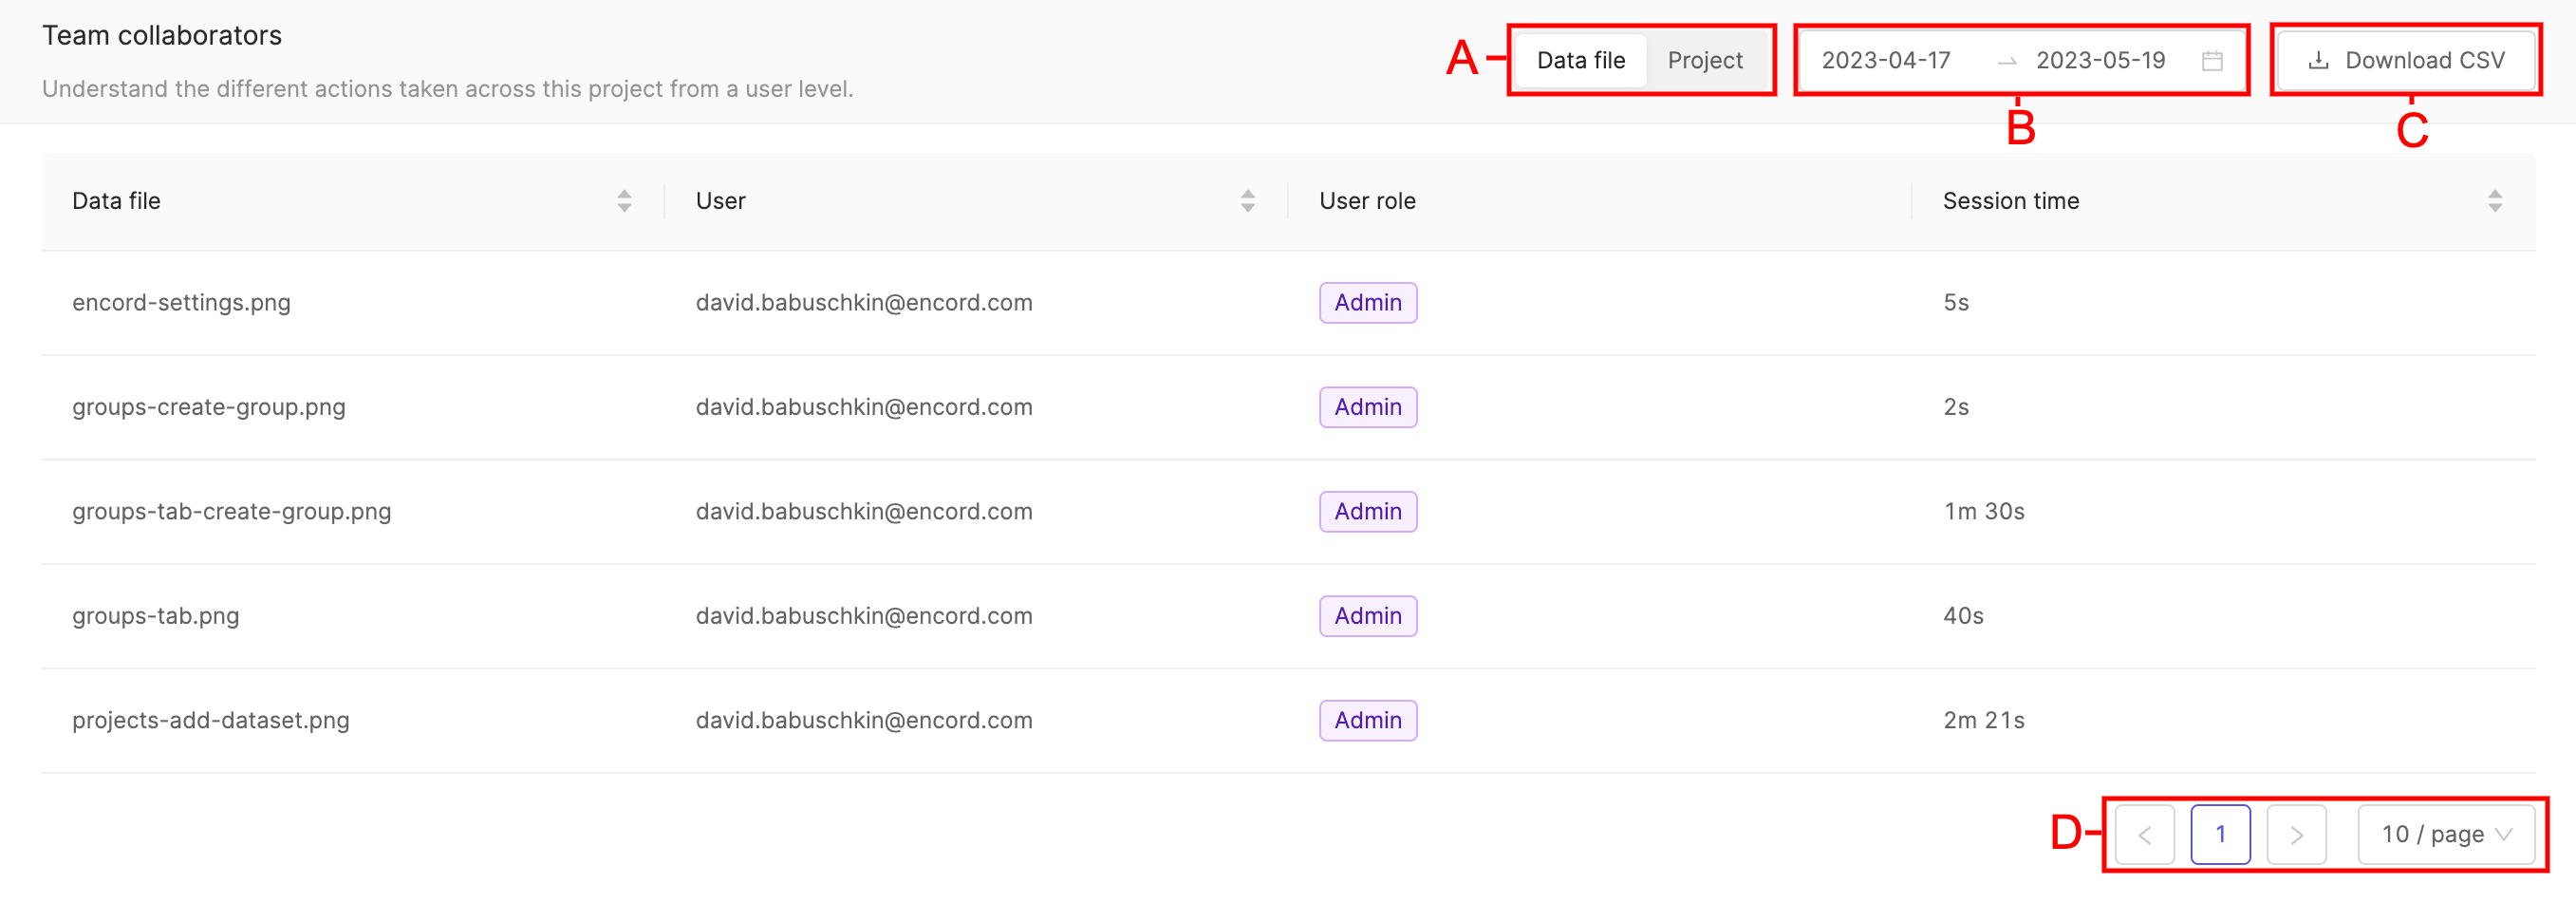
A. 'Data file' displays session time collaborators spent working on individual files. 'Project' displays session time collaborators have spent working on the project.
B. Table entries can be filtered according to dates by clicking the range of dates, and selecting the start and end date of the period you would like to see table entries displayed for.
C. Table entries can be downloaded in CSV format by clicking the Download CSV button.
D. When lots of entries are present they will be split across a number of different pages. The number of table entries per table can be adjusted.
Performance - Details
The Details tab of the performance dashboard gives a more detailed view of your team's labeling and productivity. The below details will be displayed for Benchmark QA projects.
Caution
The Details tab of the performance dashboard only shows information for labels created in the Label Editor. Labels submitted via the SDK will not be shown on the Details tab. This includes labels that were submitted using the SDK, and edited in the Label Editor.

Tip
You can specify a range of dates, as well as whether statics should be displayed for labels, or instances. More information on instances and labels can be found here.
Training performance
The 'Training performance' section provides you with insights into labeling activities of annotators in the project.
-
Click the Re-calculate scores button to re-calculate all benchmark scores displayed on this page.
-
Click the Download CSV button to download a CSV file of these records.
Overview tab
The Overview tab can be seen in the screenshot above. It lists the following information:
- User: The user's email address.
- Total benchmark tasks: The number of tasks in the benchmark Project.
- Submitted benchmark tasks: The number of tasks submitted belonging to the benchmark Dataset.
- Benchmark results: The user's percentage score against benchmark labels.
- Progress: The percentage of benchmark tasks completed relative to the total.
Annotator submissions
Tip
Click the + button next to a user's email address to reveal the Annotator submission details.
The Annotator submissions tab lists the following information:
- Annotator: The user's email address.
- Data Unit: The task's file name.
- Instance: The ontology instance being referred to.
- Benchmark answer: The benchmark classification and label. To view the label, click
 .
. - Annotator answer: The annotator's classification and label. To view the label, click .
- Score: A score measuring the annotator's label when compared to the benchmark label.
Annotator session time

The Annotator session time table displays the duration of time each annotator spent labeling the tasks in their queue.
- Data file: The task's file name.
- User: The user's email address.
- User role: The user's role.
- Session time: Time spent labeling tasks.
Submissions
The Submissions graph displays there number of submitted labels within a given range of time.

Models
The Models page allowed you to manage micro-models linked to your project. For information on models, please see our documentation here.
Export
Note
This tab is only visible to project Admins
Use the Export page to export your data. Please see our exporting data page to learn how to do this.
Settings
The Settings tab allows you to make modifications to your project using the following tabs:
- Options - Copy a project, modify datasets, modify ontology, upload annotation instructions, modify project tags, QA settings.
- Team - Manage collaborators on a project.
- Danger zone - Delete your project.
Options
Copy a Project
To copy a Project, click the Copy project button in the Options section of the project's Settings. This opens the copy Project window. From the Copy Project window, you can pick the various parts of your project you want to copy over into your new project.
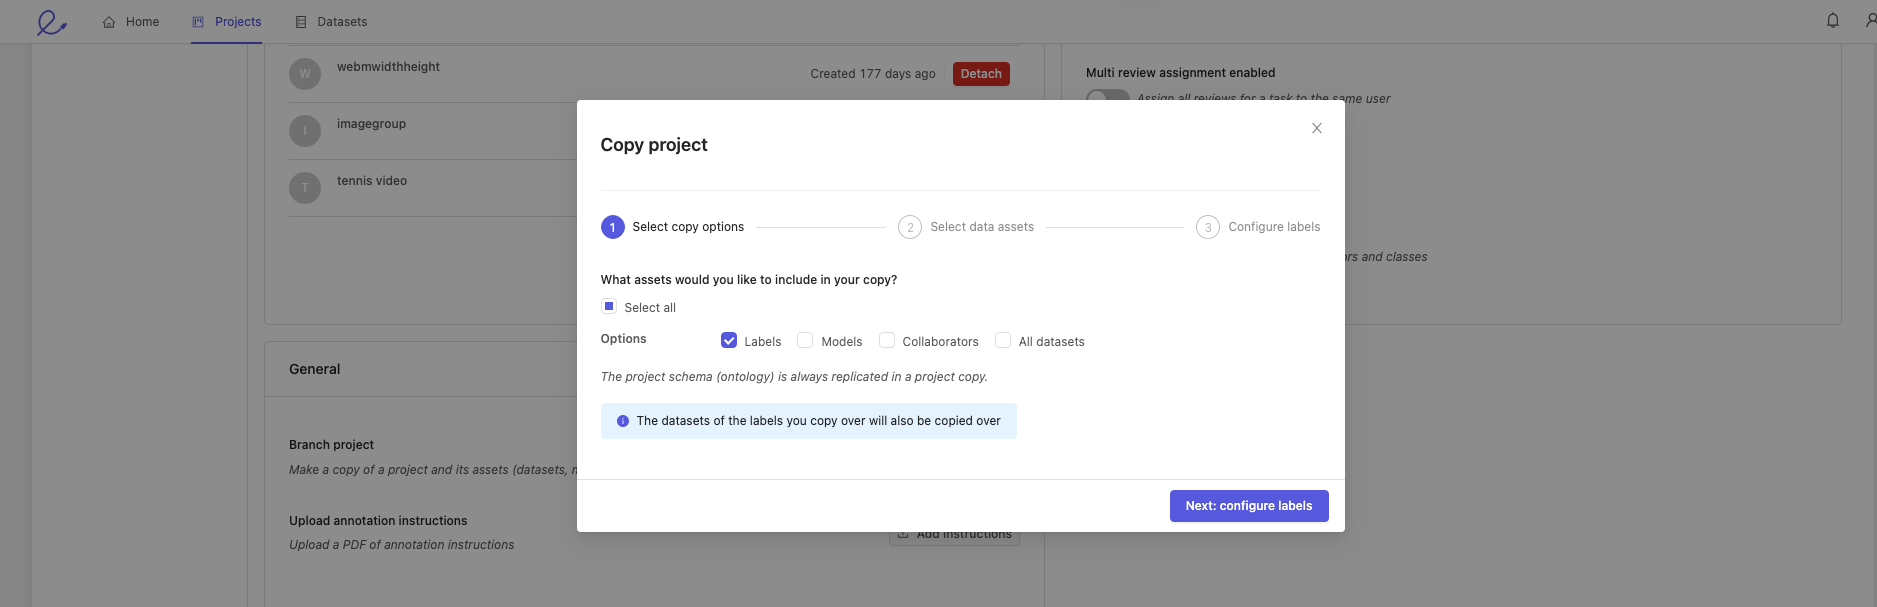
1. Select copy options
Choose the parts of your project you want to copy.
You can copy any combination of the following assets:
- Labels: this will copy the labels within videos and image sequences of your choice.
- Models: this will copy all the models in your project along with their training logs.
- Collaborators: copy all project users with their respective roles. Project admins are copied regardless of whether this is selected.
- All datasets: all datasets will be copied, and new annotation tasks will be created for all videos and image sequences if their labels were not copied over (see next line).
Tip
Confused about the difference between image groups and image sequences? See our documentation here to learn about different data types in Encord.
The new annotation project will use the same ontology as the original. This can be changed in the project settings if required.
-
If you don't want to copy labels, press Copy project. This will create the copy of your project, which you can then access in the Projects tab.
-
If you choose to copy over labels, you will be asked to select the data assets for which you would like labels copied over. To begin the process, press Next: configure labels. Continue to step 2. below.
2. Select labels to be copied
Select the data units with the labels that you want to copy into your new project.
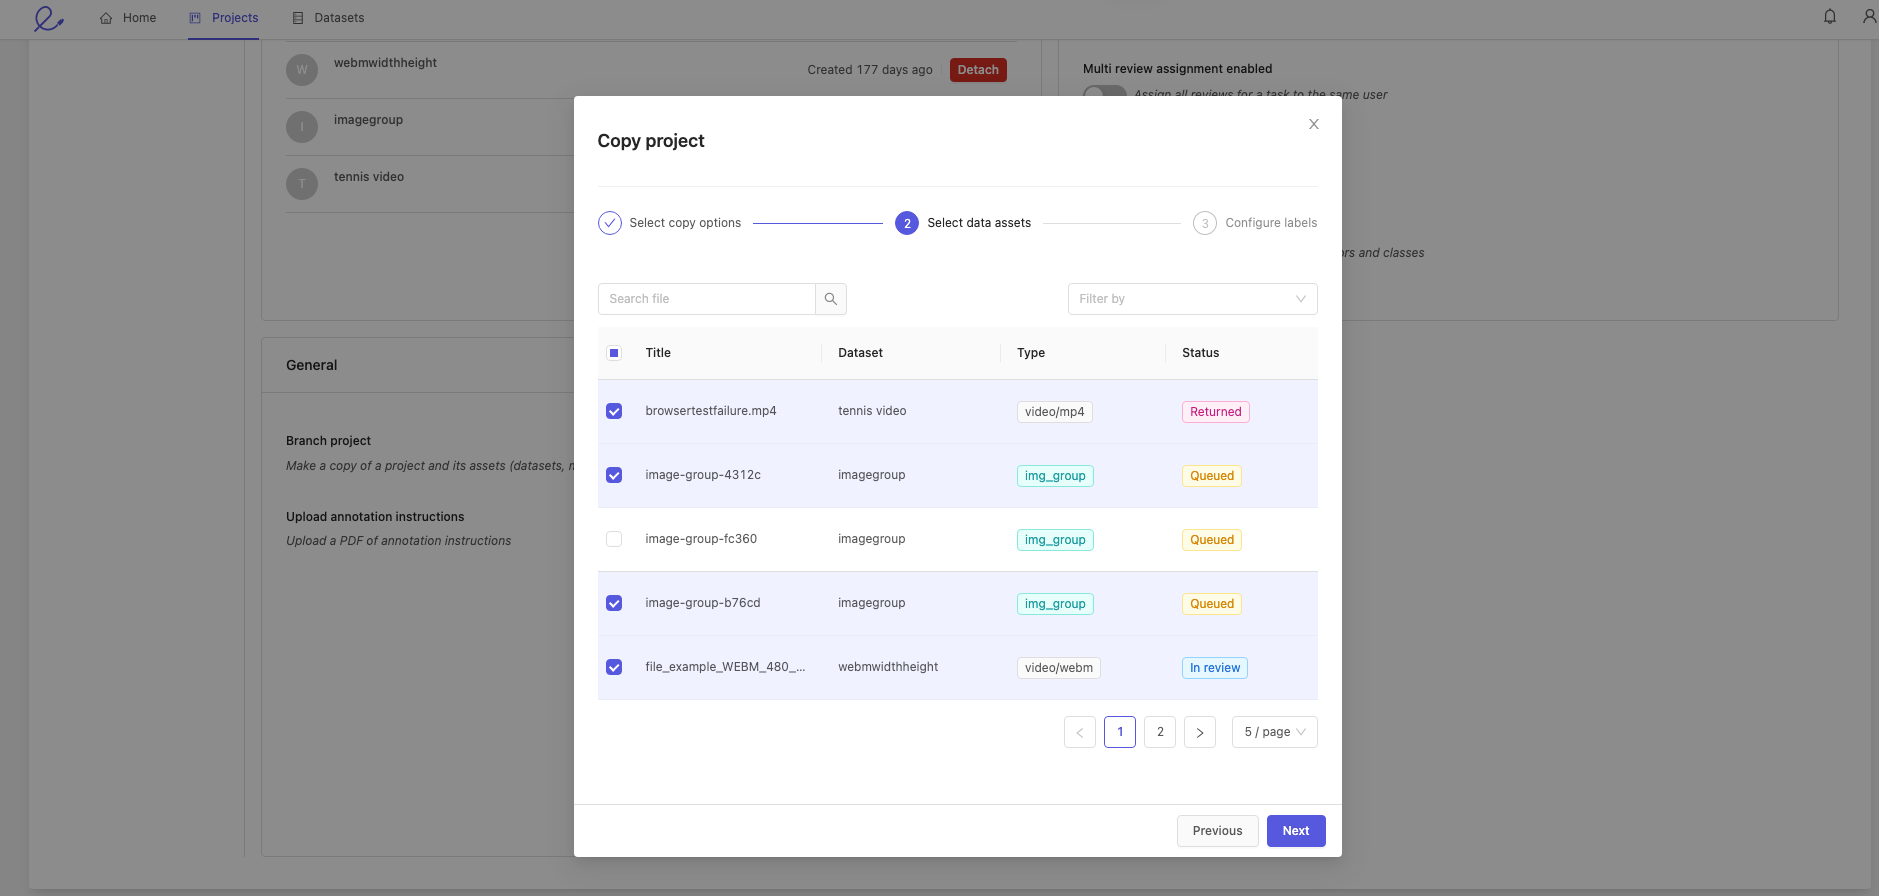
Click Next to continue.
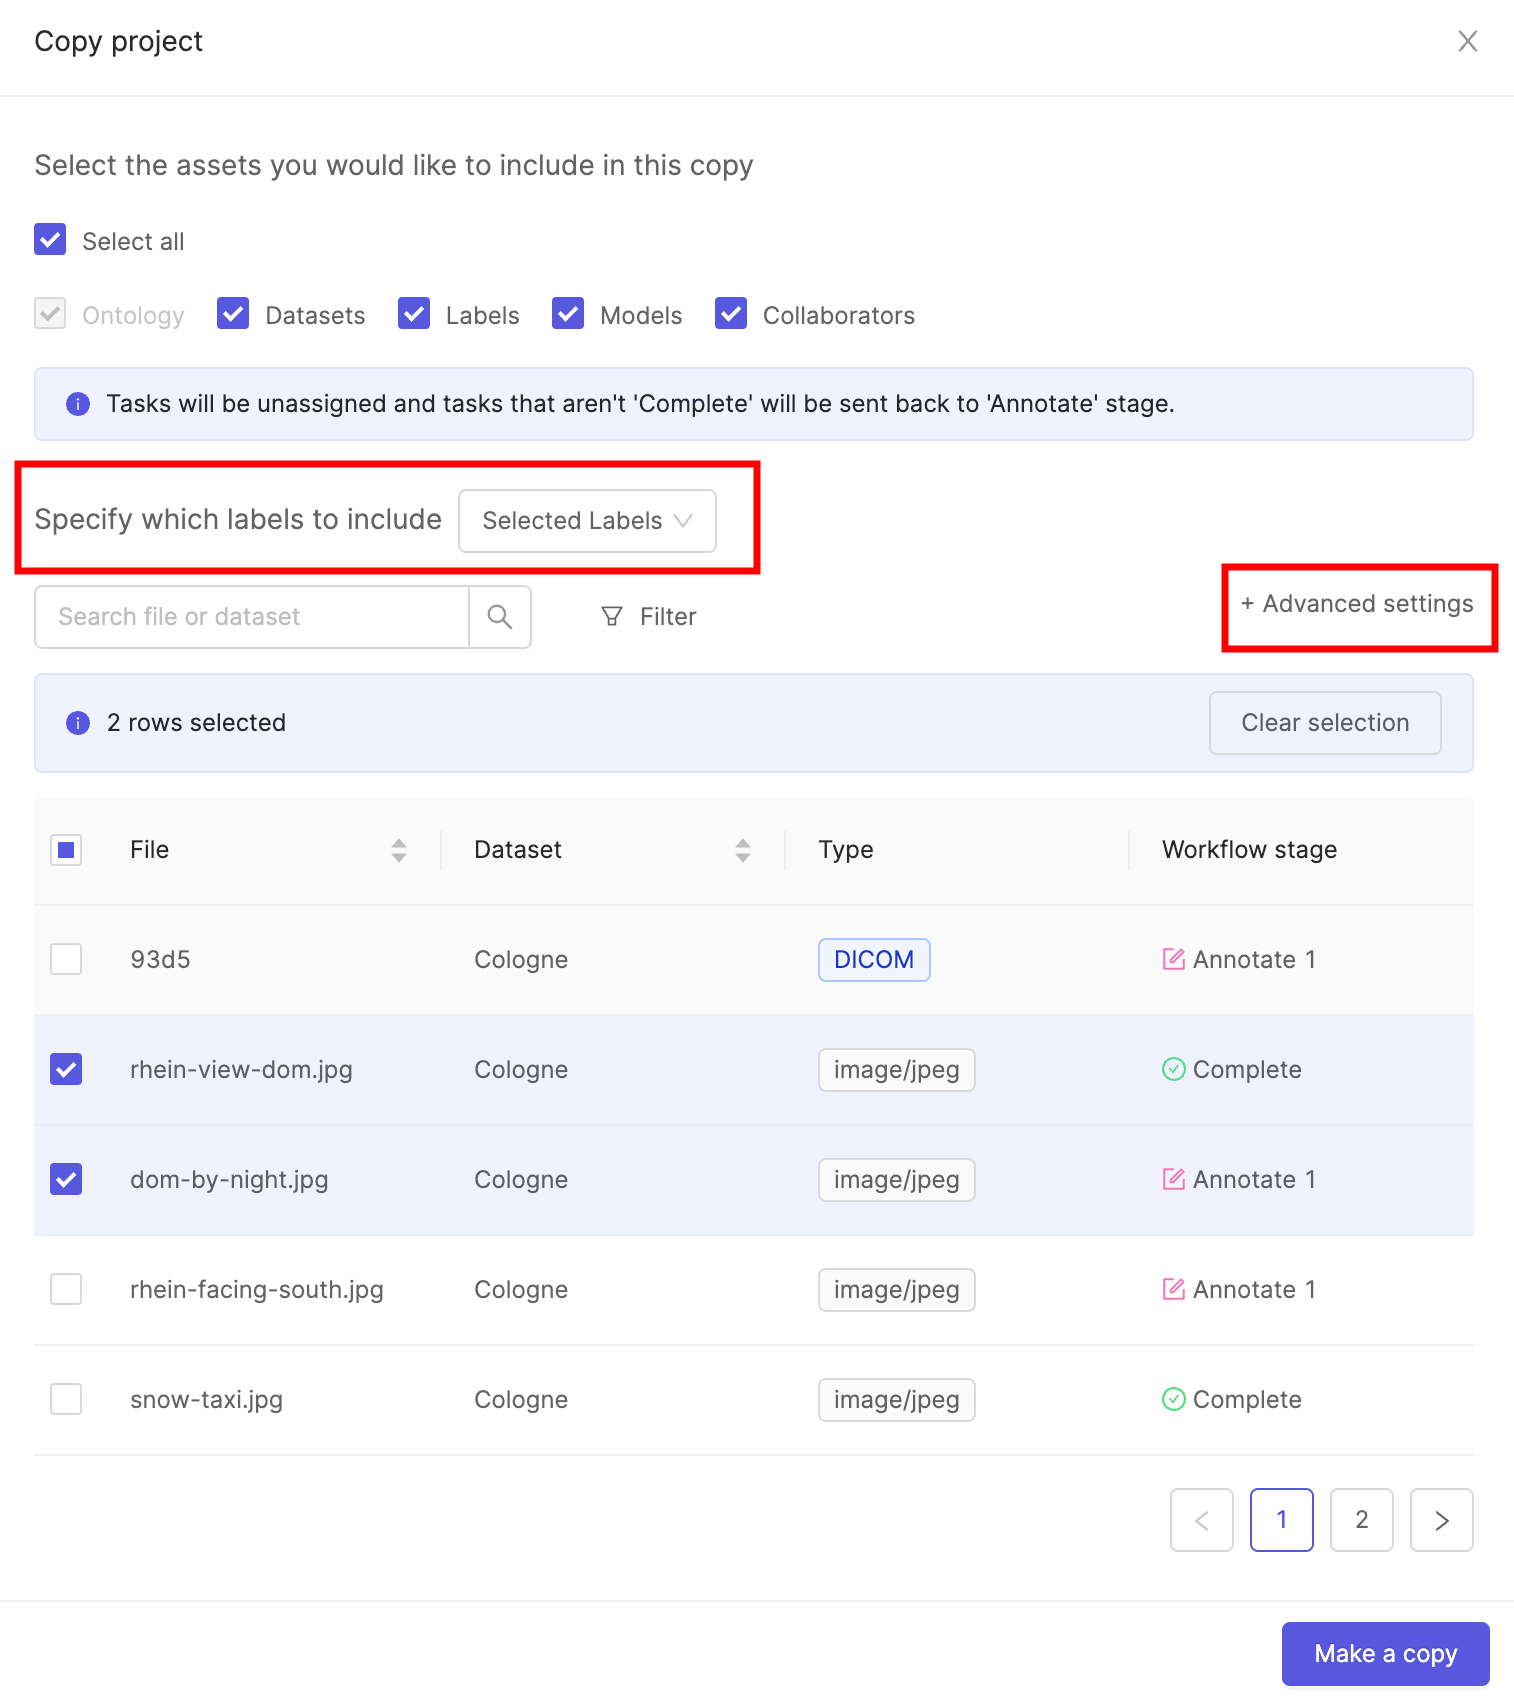
3. Configure labels
Select the statuses of the files you want copied over into your new project.
Note
When a project is copied, the task status will not be copied.
This means that all tasks will beAnnotatetasks, and their status will beQueued.
All tasks will have to be re-assigned after being copied.
Click the Copy project button to complete the process.
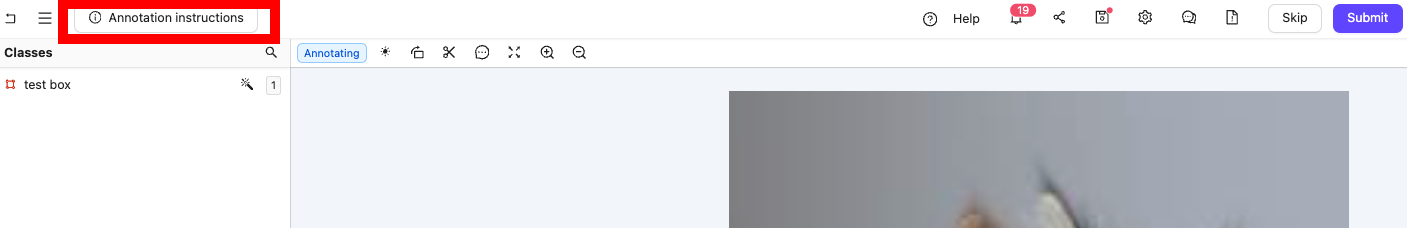
Upload annotation instructions
Video Tutorial - Uploading annotator instructions
-
Click the Add instructions button to upload instructions for your annotators in PDF format.
-
To ensure the best possible results, provide as much detail as possible about what you would like annotated and how precise bounding boxes should be drawn. For example, instead of saying 'person', consider defining what should constitute a person for your annotators - only a full person? A torso? Or should any part of a person in a frame be labeled as a 'person'?
Note
The more specific your annotator instructions, the higher the chances that your annotators will perform well.
- Once uploaded, annotation instructions will be accessible within the Label Editor.
Project tags
Note
Tags are created and managed on the Organization level. Once created they can be added to individual Projects.
You can add tags to a Project if you are part of an Organization.
Project tags allow you to:
-
Flexibly categorize and group your Projects.
-
Filter your Projects.
Adding and removing tags
You can add tags to your projects in:
-
When creating a Project.
-
In the Settings page of a project.
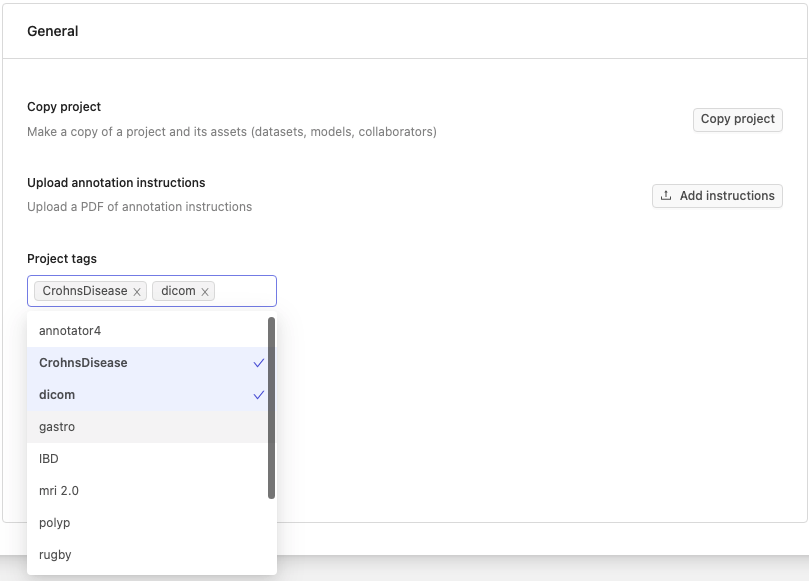
To add tags to your Projects in the Settings page, navigate to the Options tab and click the Project tags drop-down. Here you will see the available tags in your organization. Click on a tag to add it to a Project. You can remove a tag from your Project by clicking the same tag again, or clicking the x button next to its name.
Filtering Projects by tags
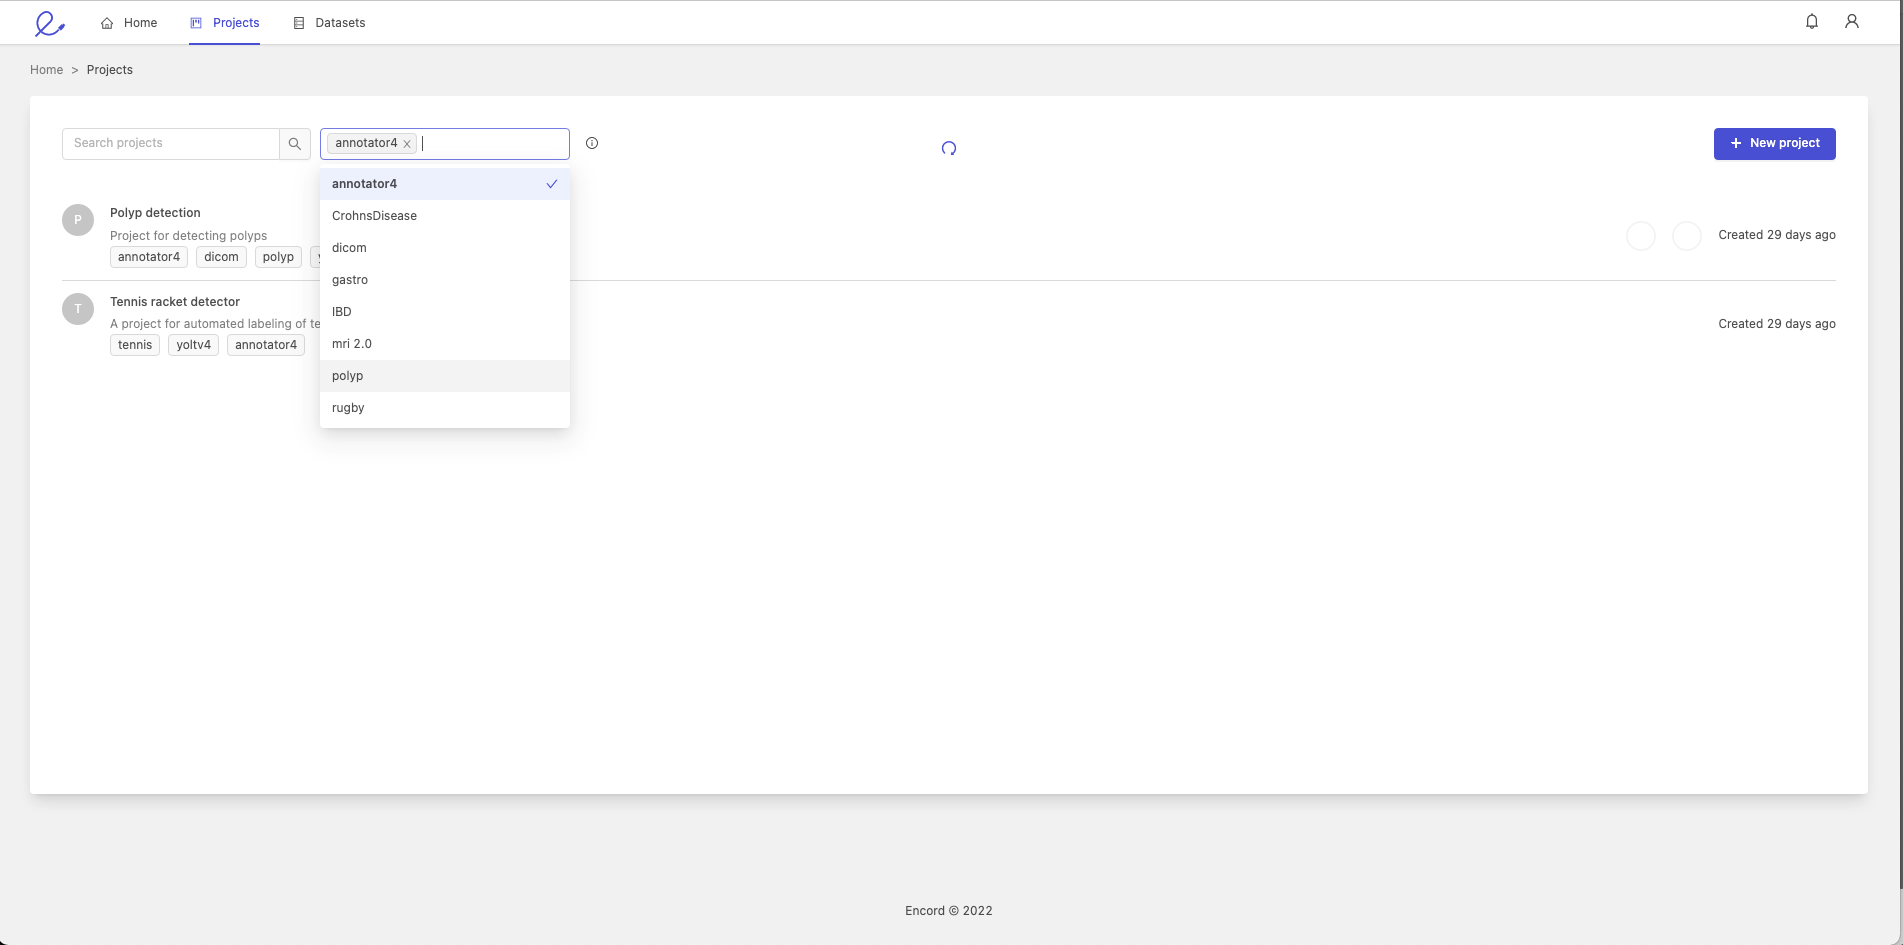
You can filter your Projects based on the tags they contain. Click on the Projects tab in the navigation bar, click the Filter by tags drop-down and select one or more Project tags. This will result in only Projects with the tags being selected being displayed.
Edit project Ontology
You can view or switch the Ontology attached to your Project.
Note
Changing the Ontology can render existing labels invalid and lead to data inconsistency.
-
Click the Switch ontology button to switch the ontology linked to your Project.
The resulting pop-up allows you to choose an existing ontology from a list, or create a new ontology for this Project. -
Click the View ontology button to view the details of the Ontology that is attached to the current Project.
Edit datasets attached to a Project
The Datasets section allows you to attach or detach any number of Datasets to your Project. You must create a new Dataset in the Datasets section for it to become available in a Project's settings.
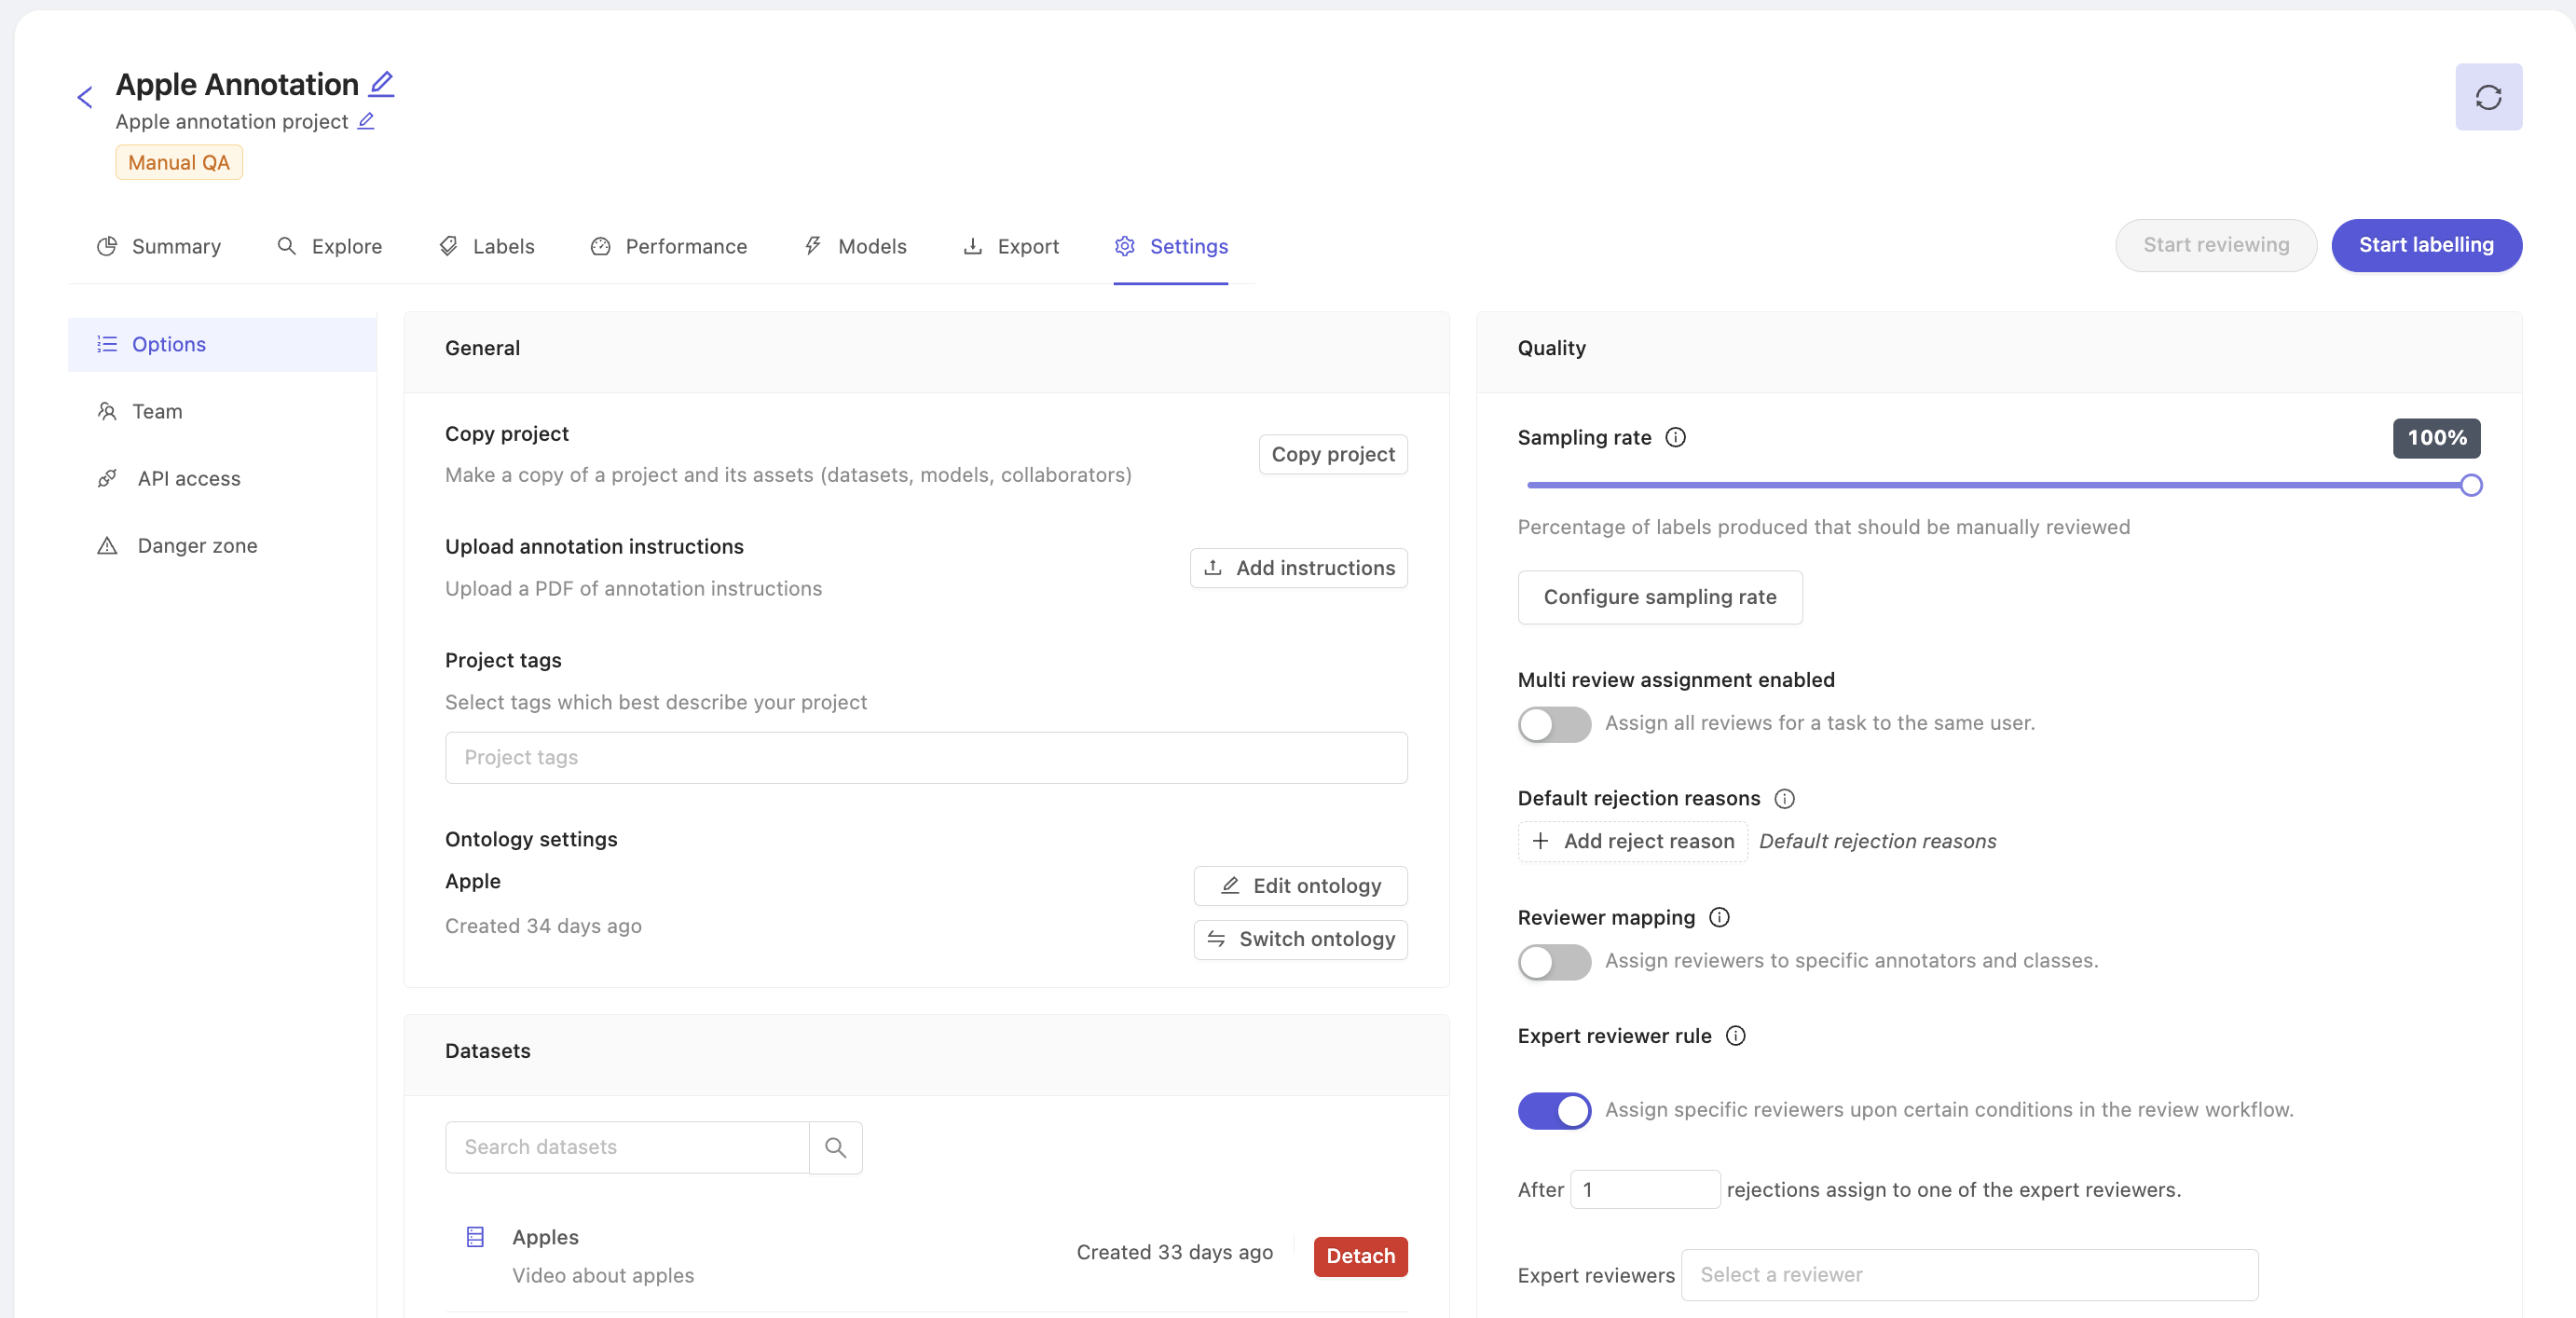
Quality Assurance
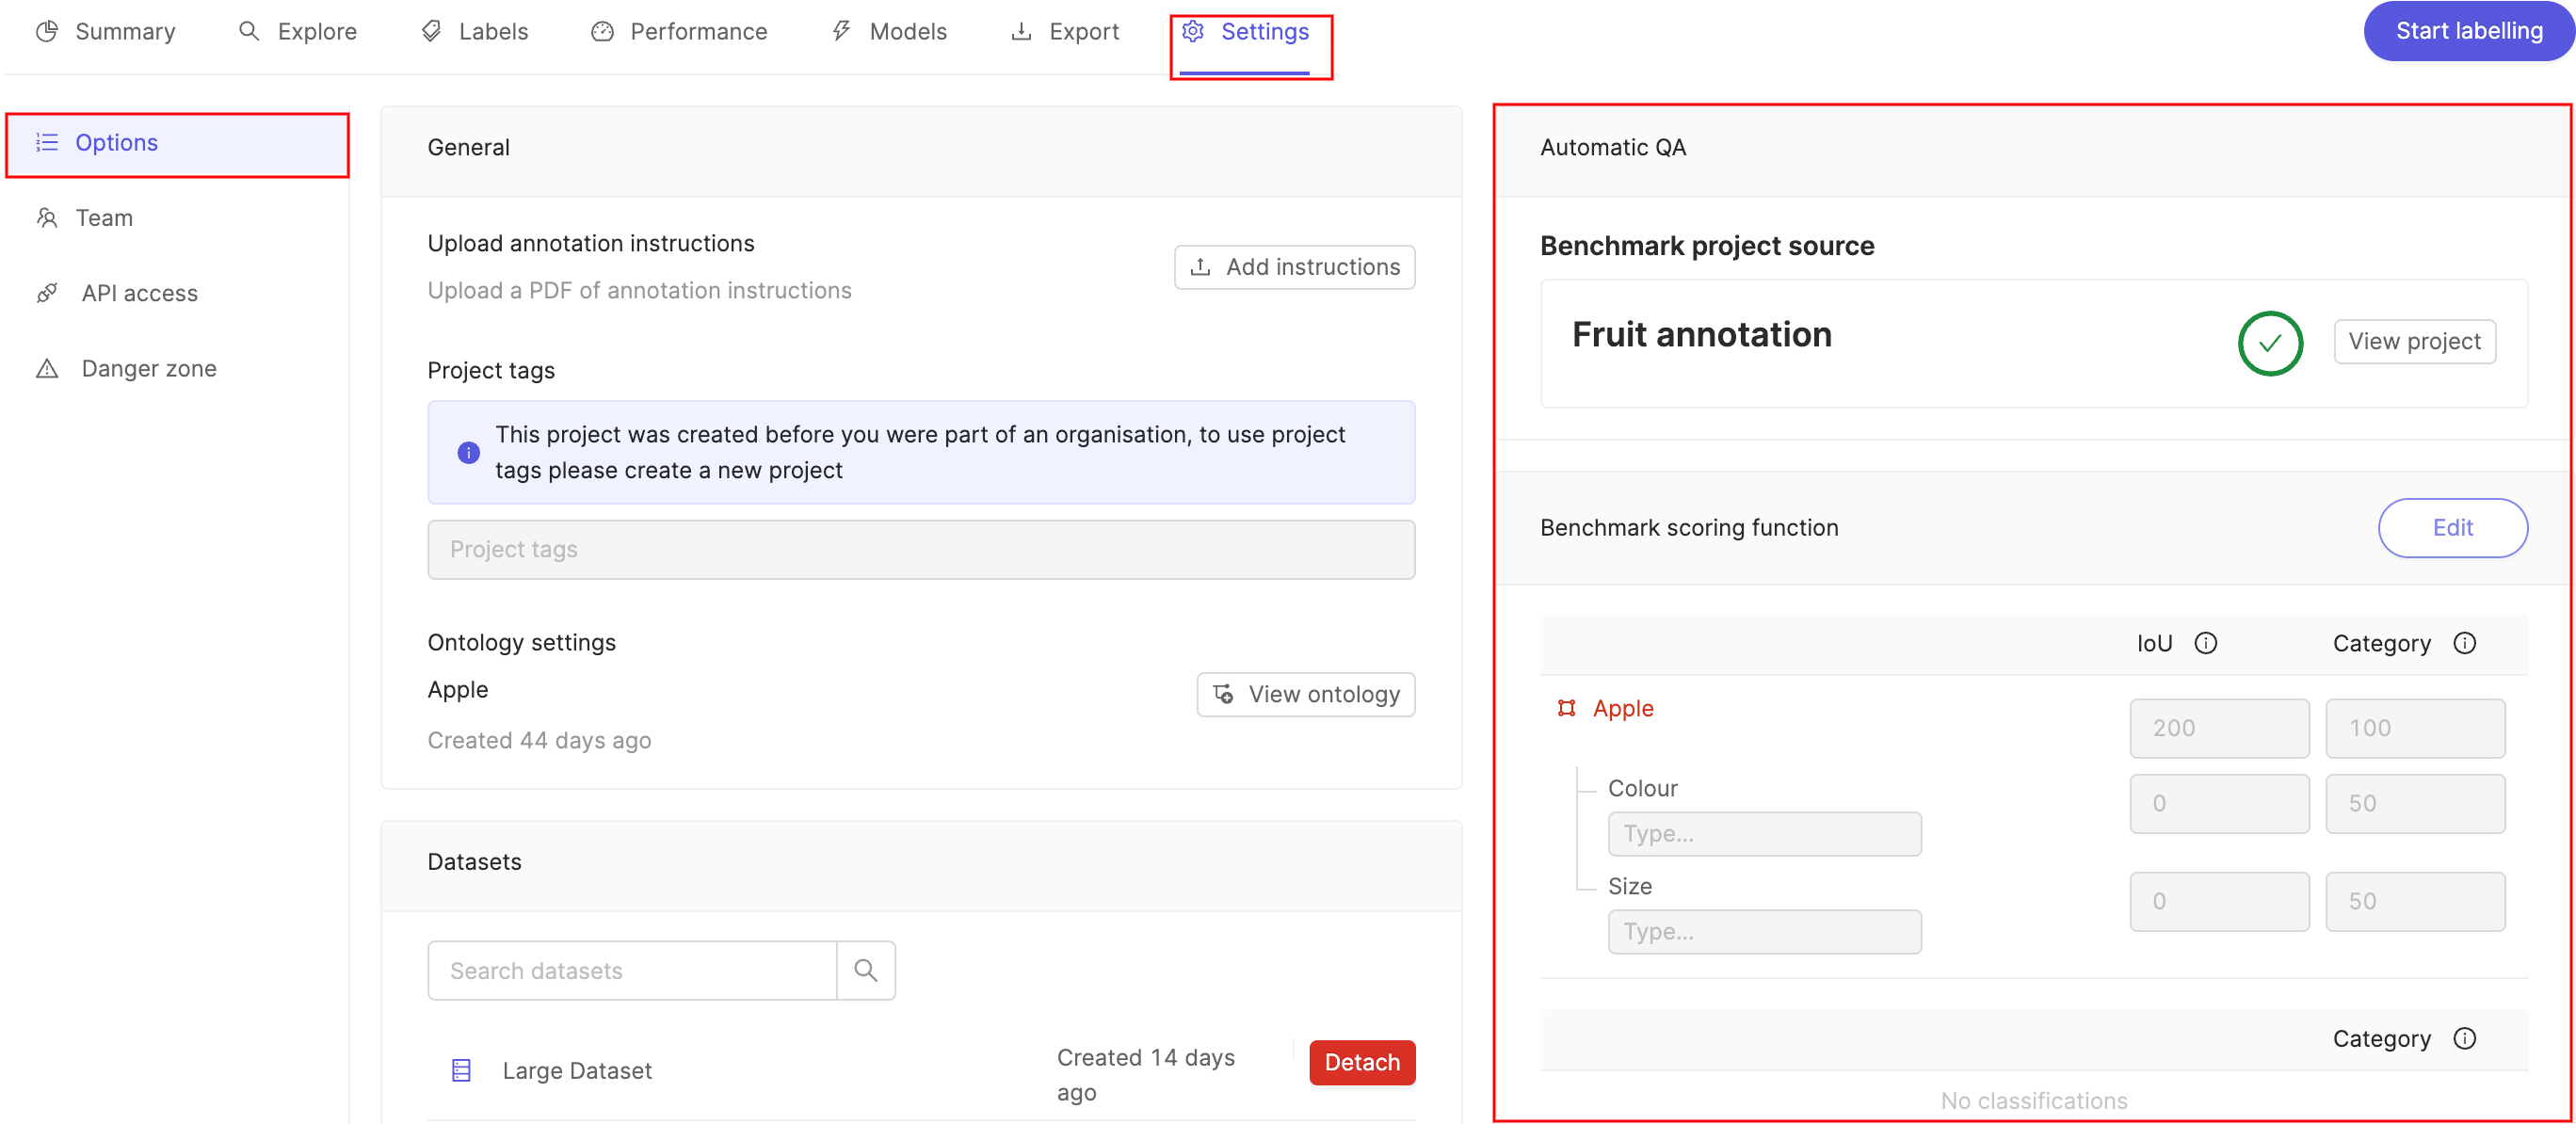
The Automatic QA section in the Options tab allows you to configure the way that benchmark quality assurance is implemented.
Note
For a precise description of benchmark QA please see our benchmark QA documentation.
-
The Benchmark project source allows you to see which project is being used as the gold standard benchmark function against which QA is done.
-
Click Edit next to the Benchmark scoring function to adjust the relative weight of the IoU and Category evaluation metrics. Click Save when you are done.
Note
The results of the Benchmark QA can be viewed on the Performance dashboard.
Team
To manage project collaborators, select the Team tab in your project Settings.
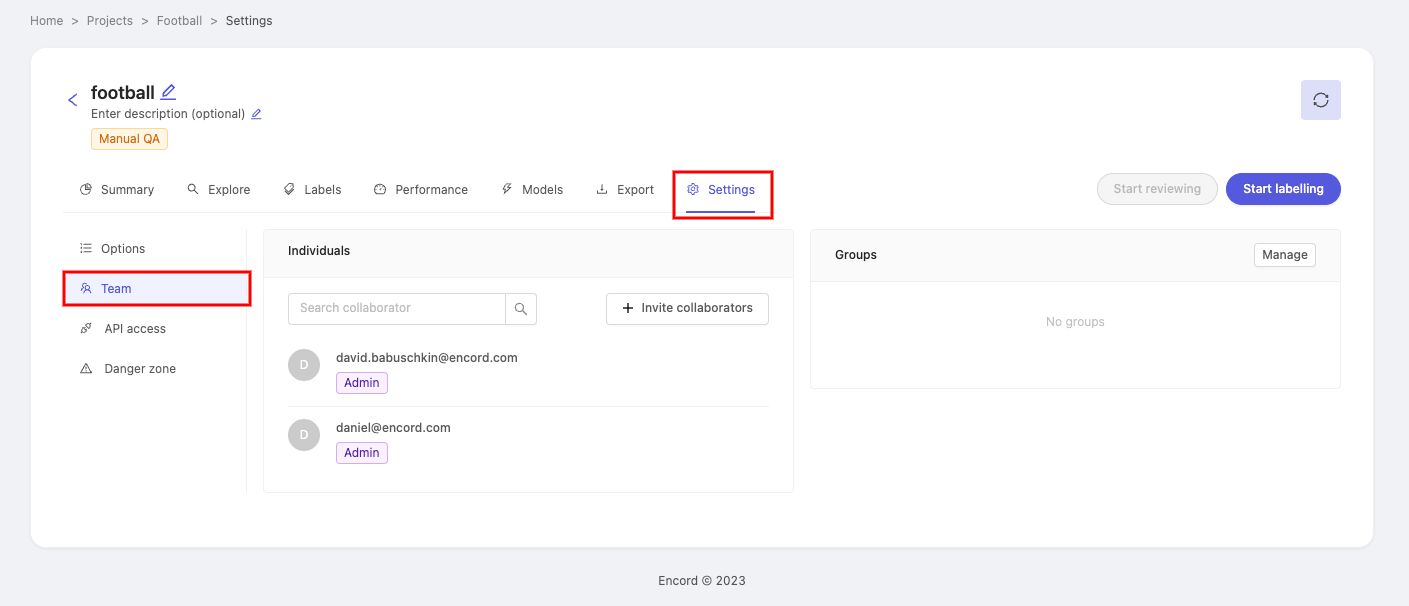
Here you can invite collaborators to the project, and configure their roles.
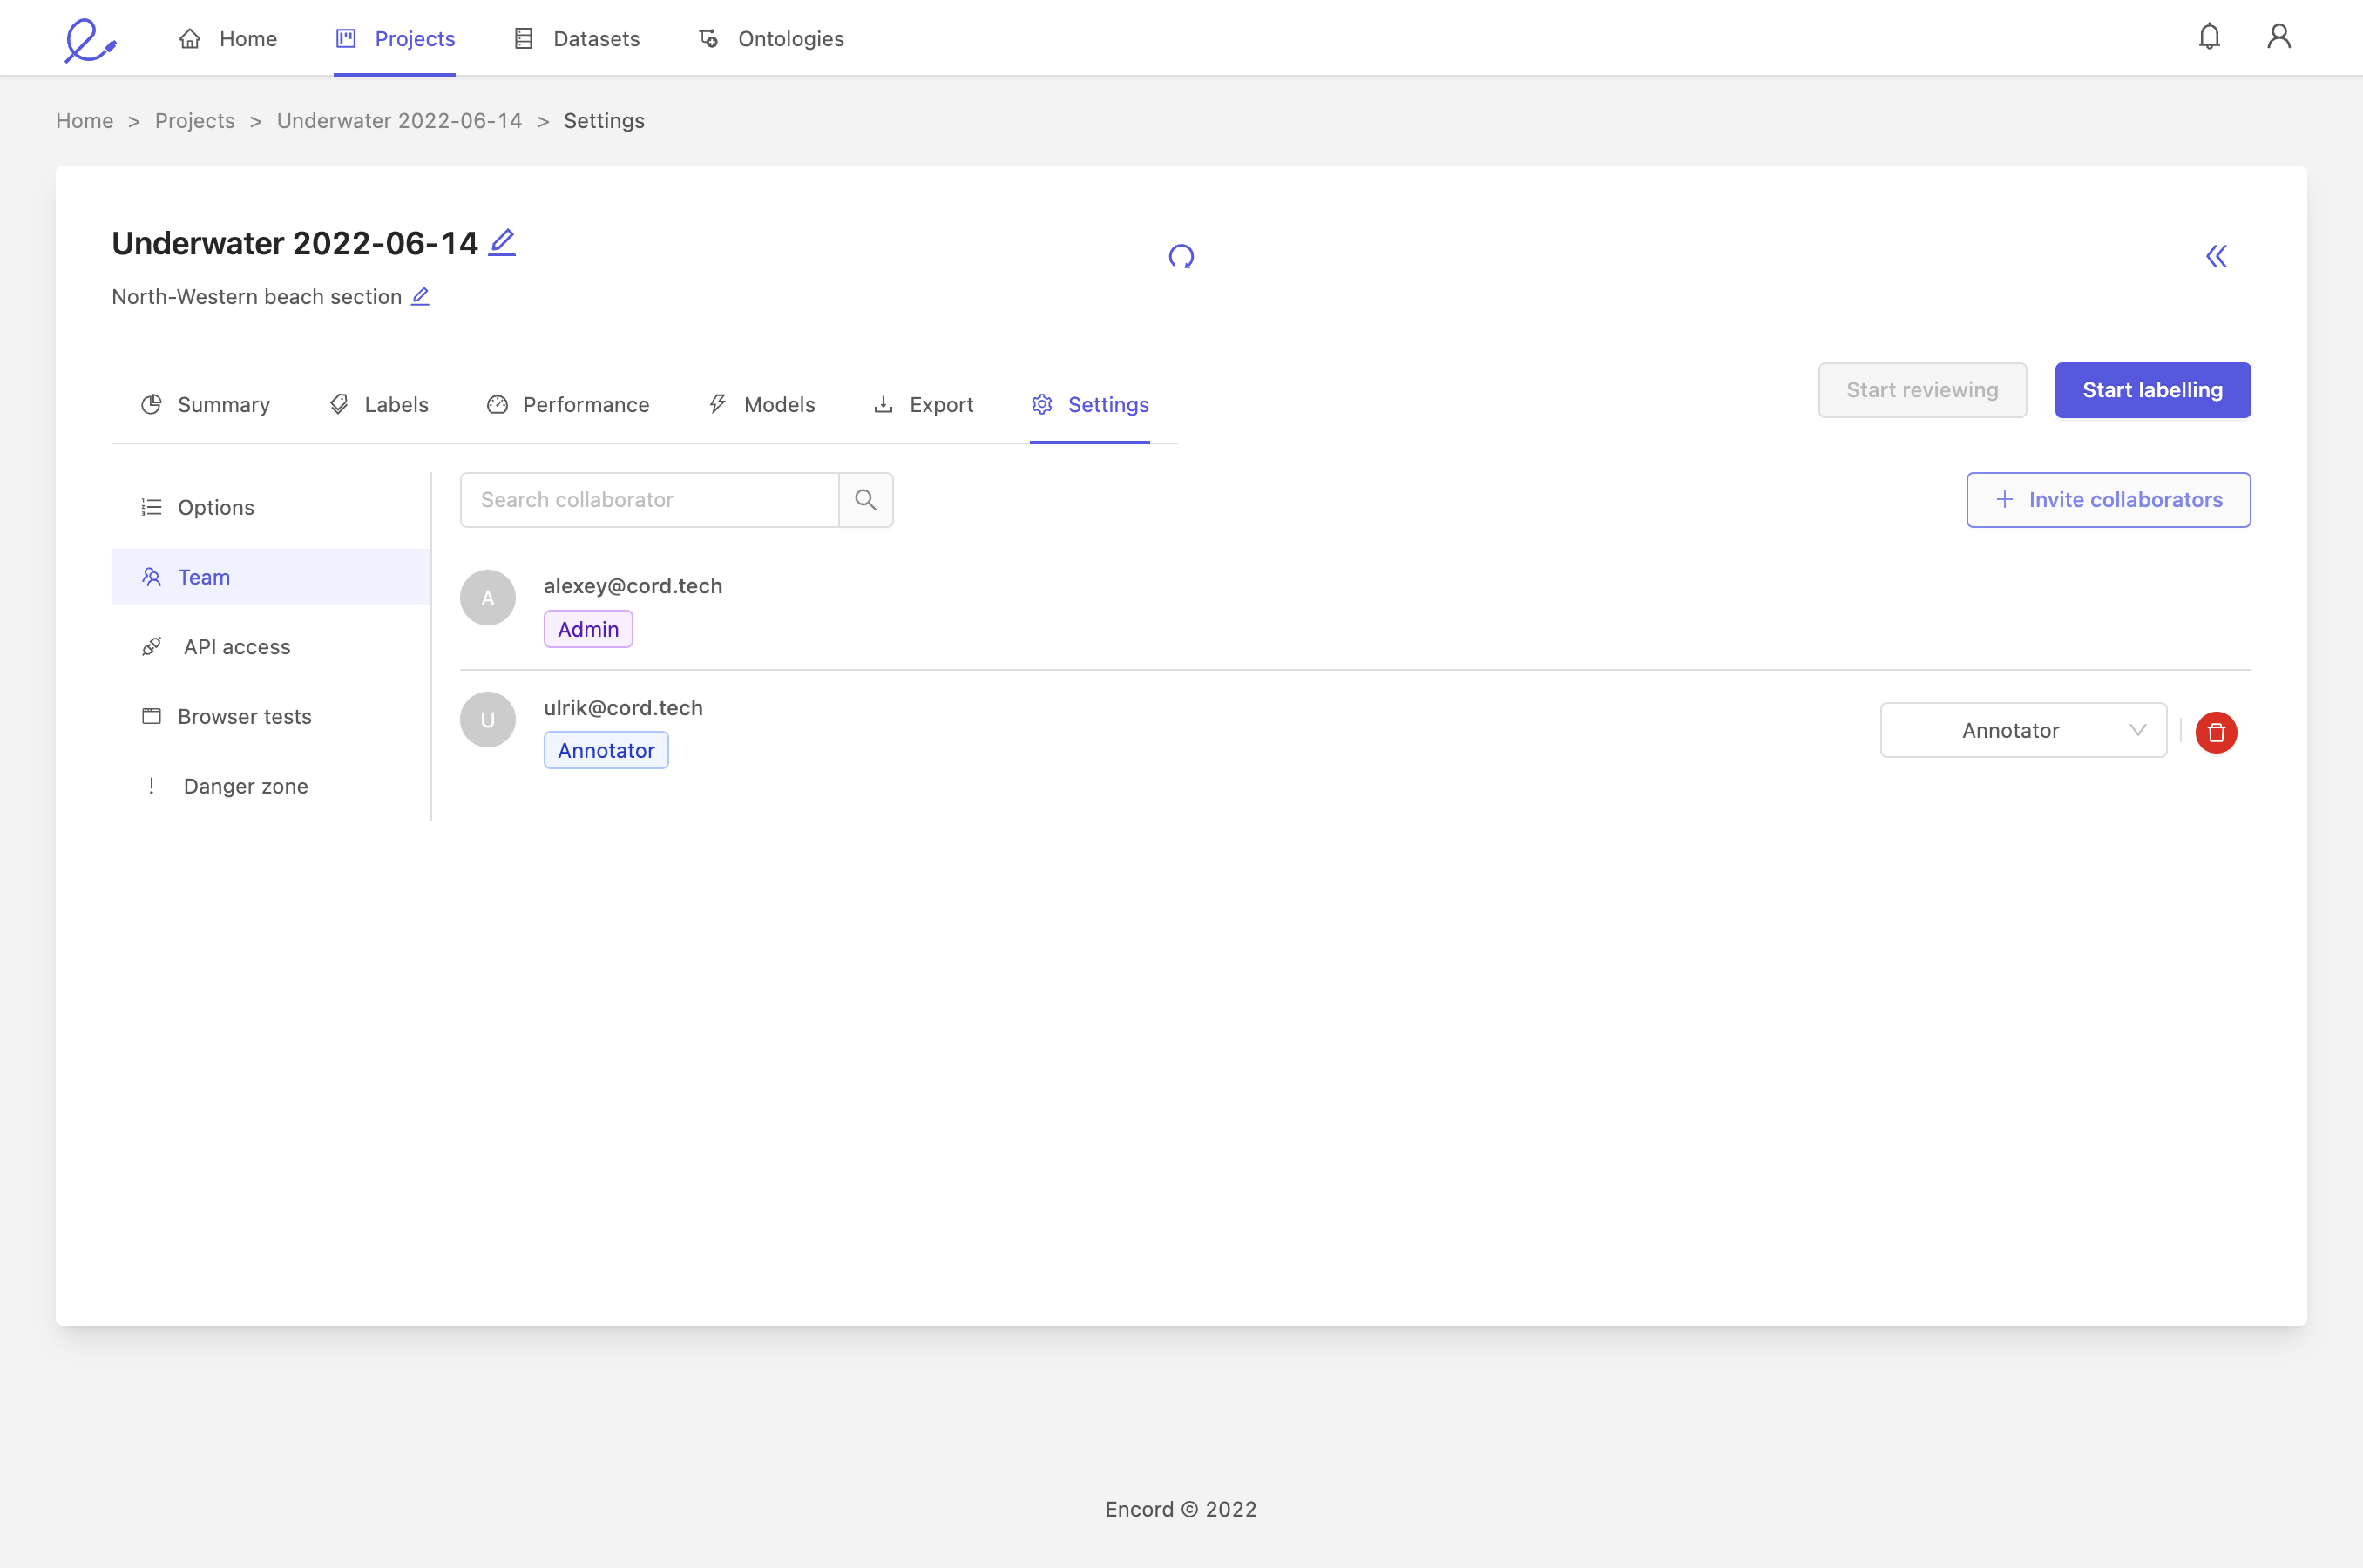
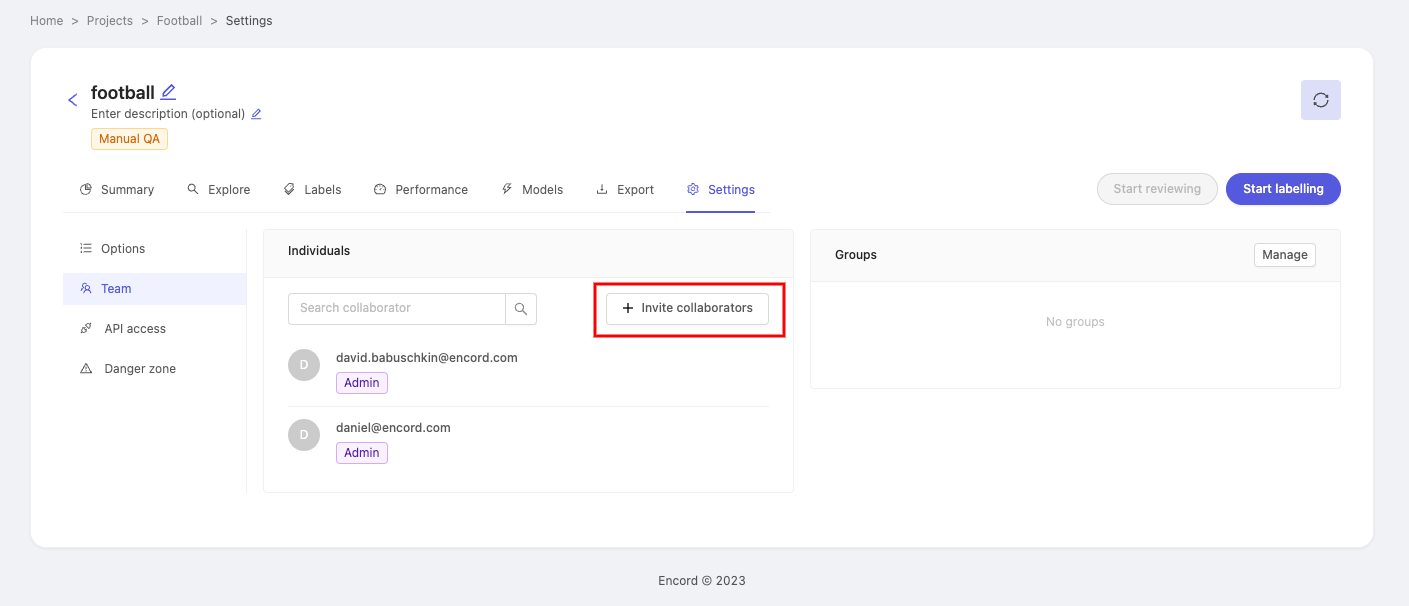
1. Add a collaborator
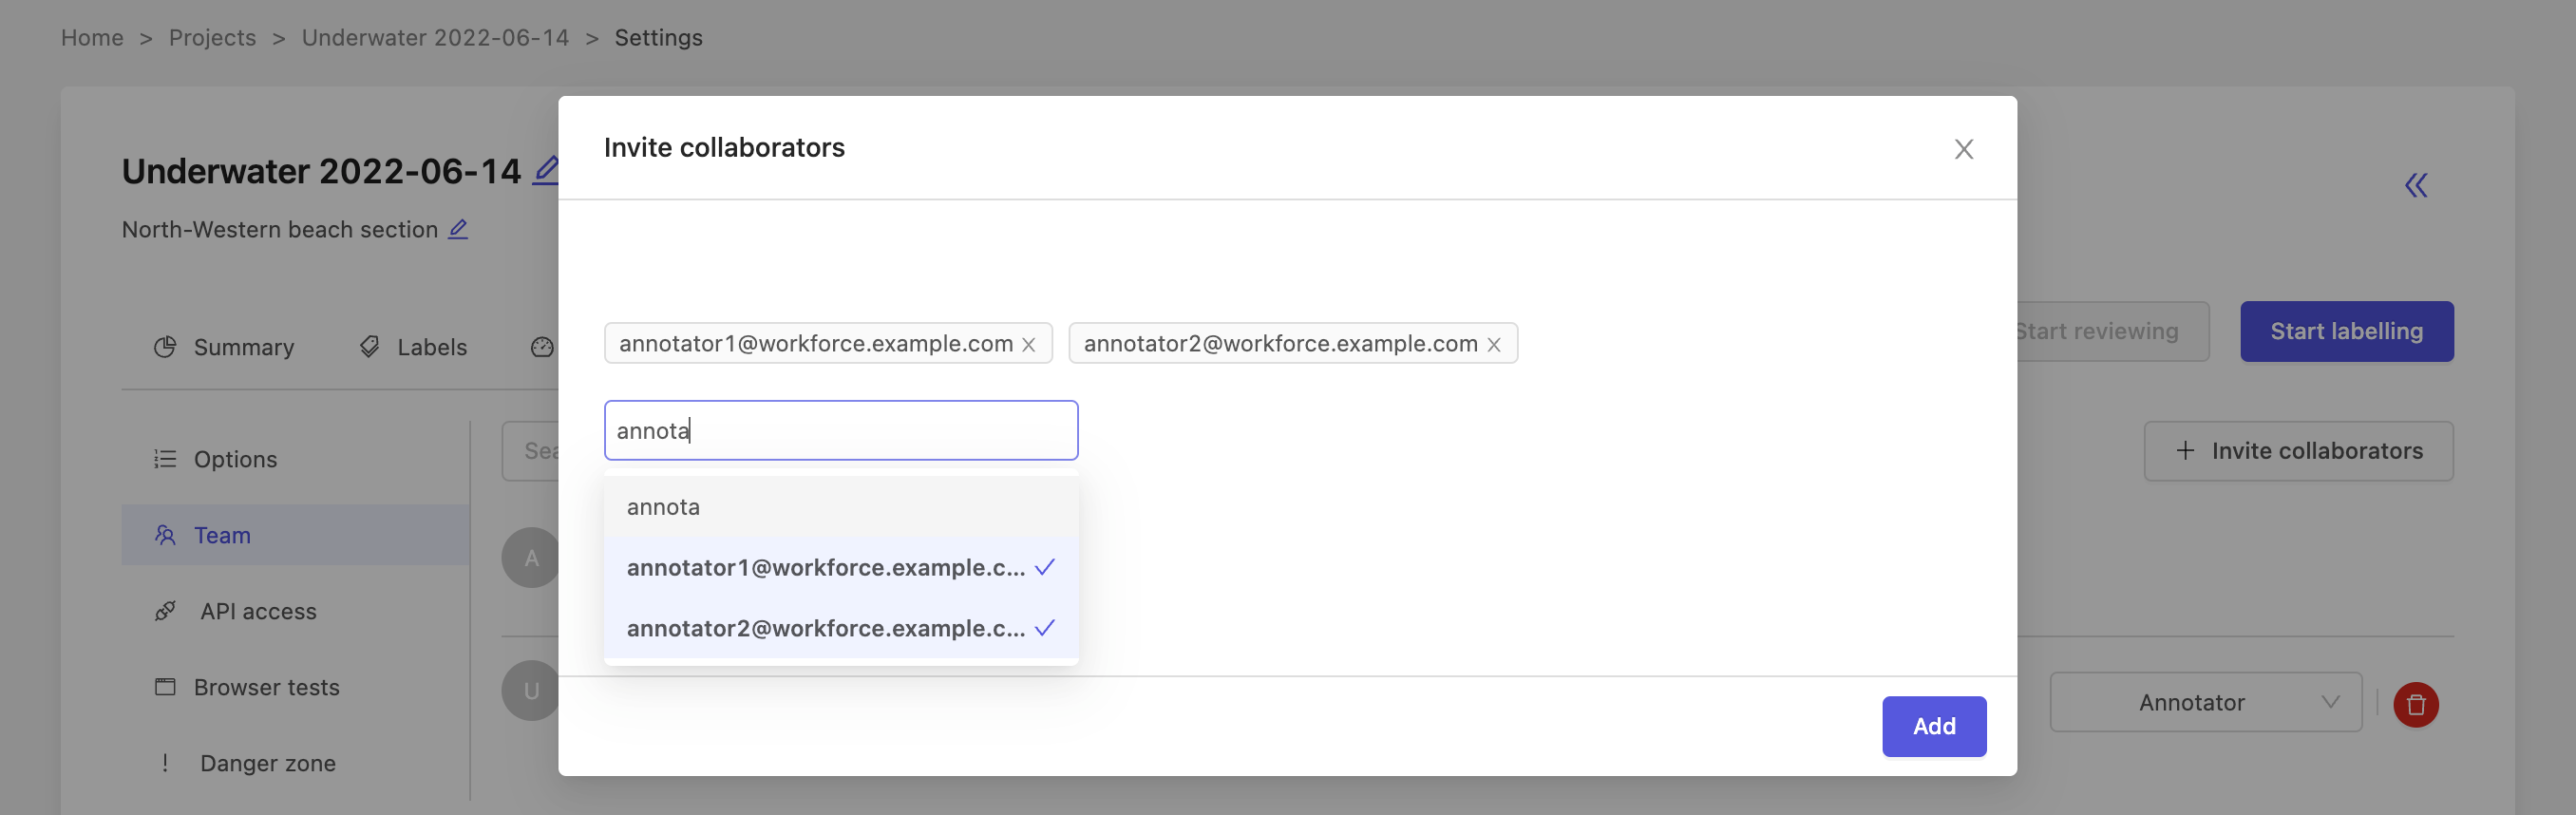
To invite collaborators to your project, click the + Invite collaborators button. This will open a new window where you can enter email addresses of the people you would like to invite.
Once you have entered everybody you want to invite, press the Add button.
2. Add collaborators as a group
Note
To add collaborators as a group, your organization needs to have user groups. Navigate to our documentation on creating user groups for more information.
Collaborators can be added to a project as a group - which can save time as well as ensure that no individual is forgotten.
In the 'Groups' section of the page, click on Manage to make the 'Manage Groups' pop-up appear.
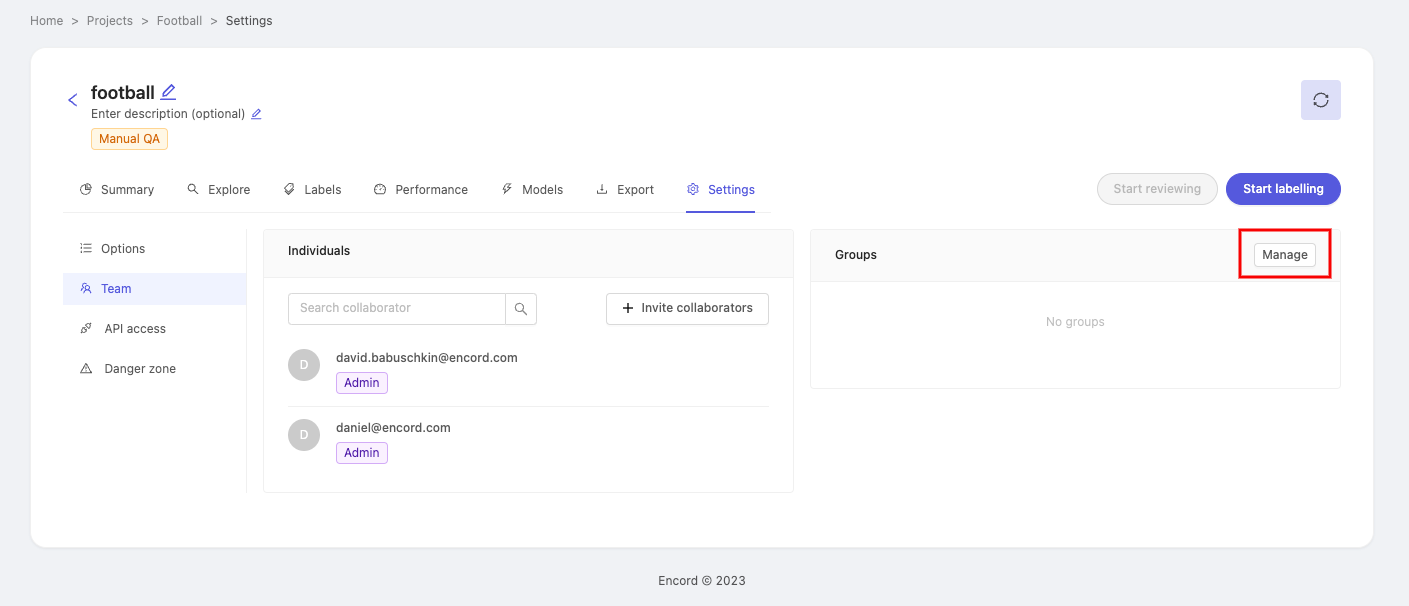
Click the 'Select group' drop-down and pick a group you would like to add as collaborators. After selecting a group, click the 'Select Role' drop-down to assign a role to the group of collaborators. Click Add to add the group.
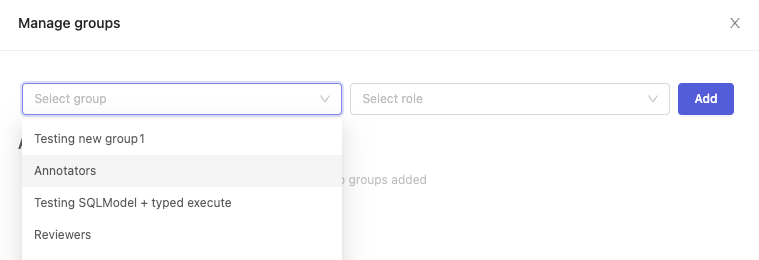
The group you just added will appear under the 'Added groups' heading. Repeat the process if you'd like to add more groups with different roles to the project.
To delete a group from the project, simply click the ![]() button next to the group name.
button next to the group name.
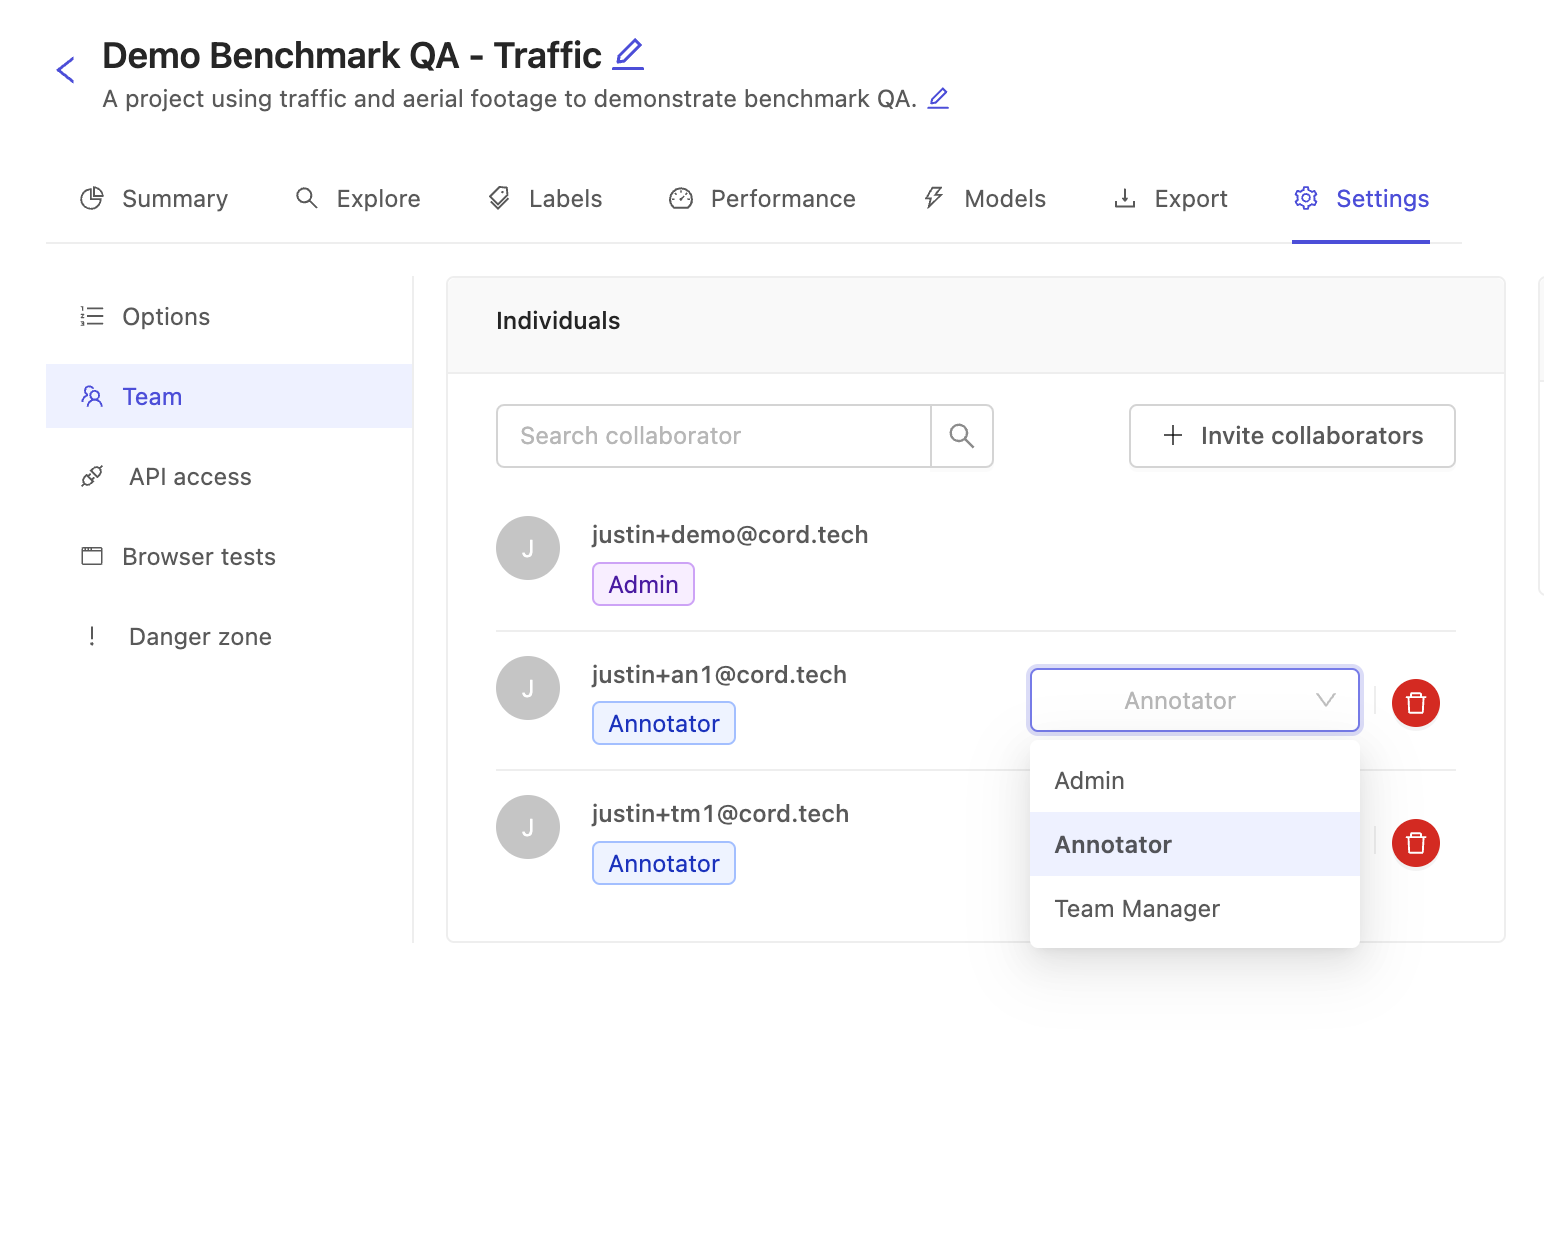
2. Change collaborator role
A project admin can modify the different roles of collaborators, using the drop-down on the right.
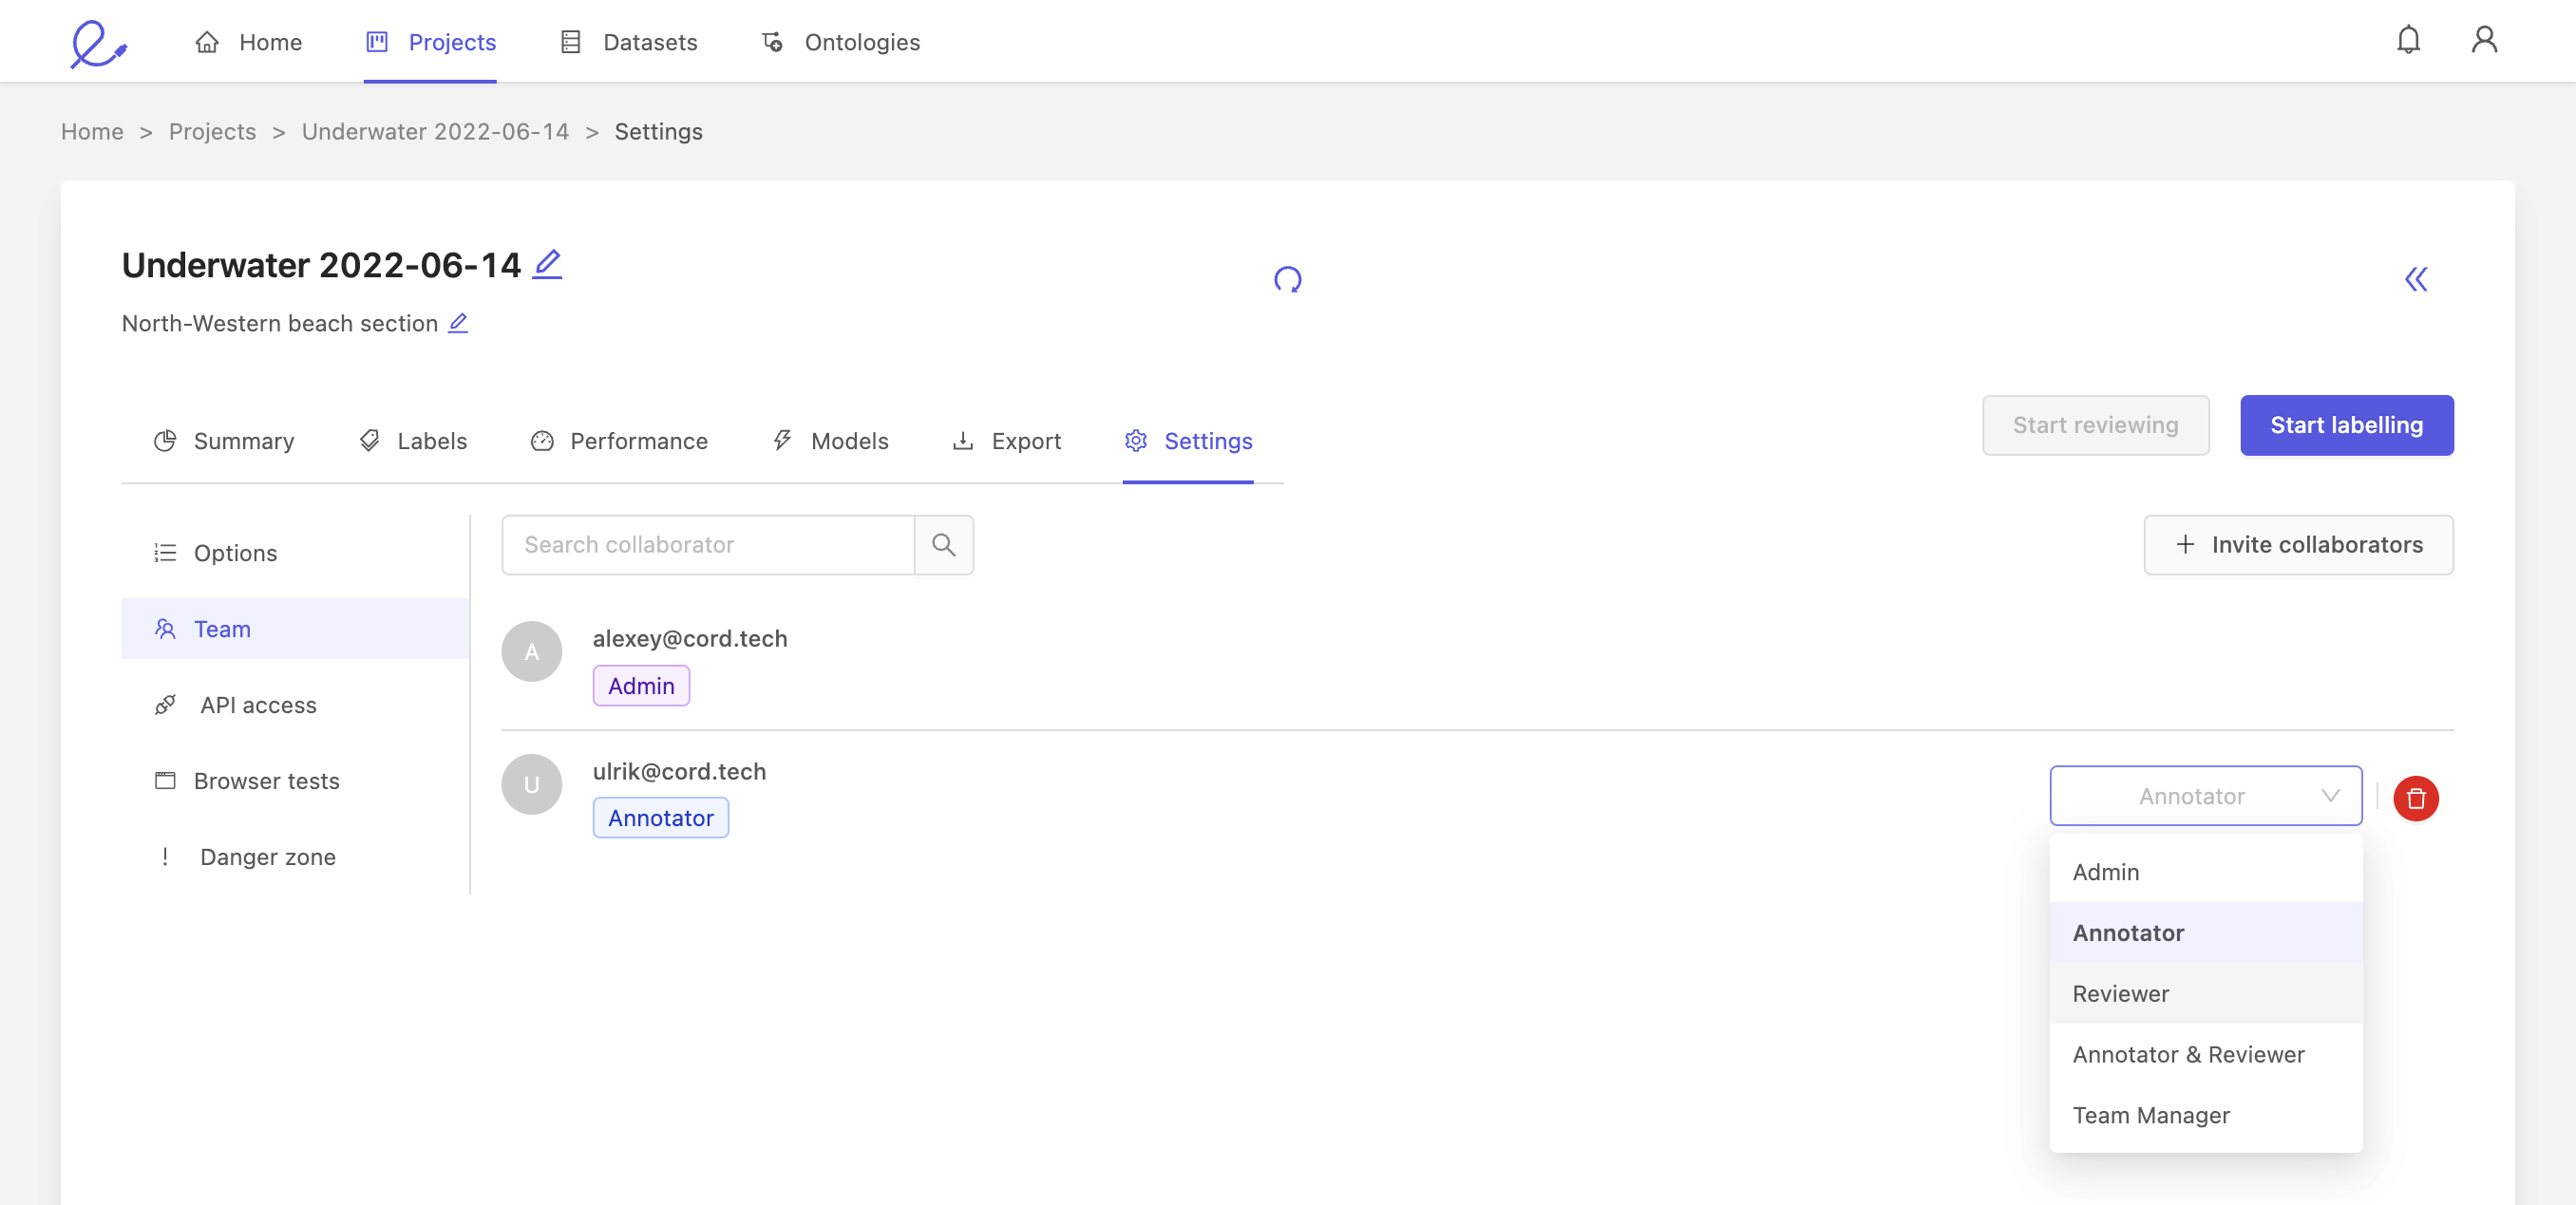
You can assign the following roles to collaborators:
- Annotator: annotators are responsible for labeling. This is the default role for all collaborators.
- Team manager: a team manager can assign tasks to other users, and add collaborators to the project.
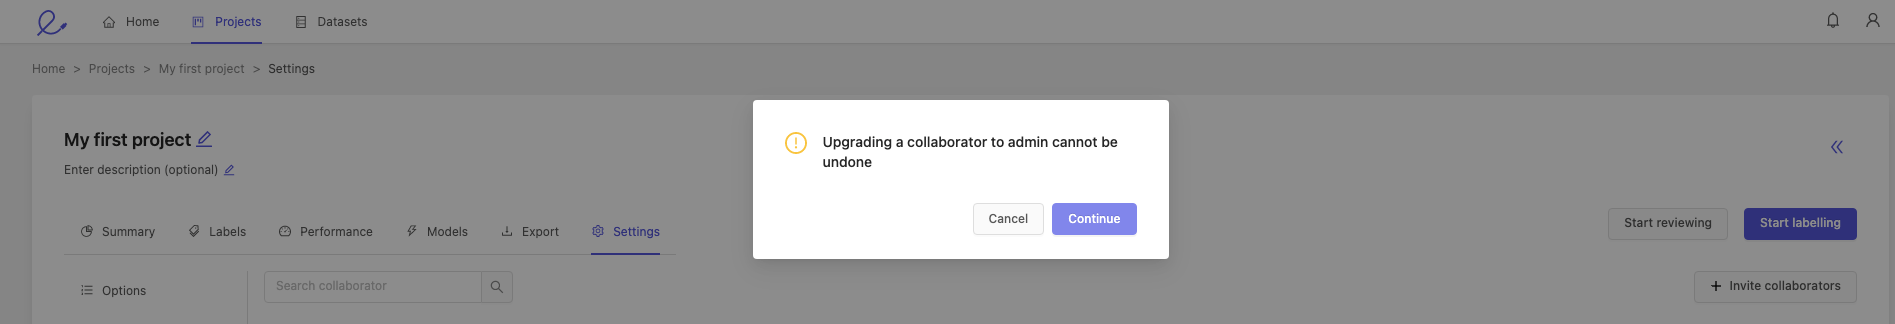
- Admin: gives this collaborator full administrative control over this project. Caution: this is an irreversible action.
Please confirm or cancel your selection when making a collaborator a project Admin.
Danger zone
You can delete your project by going to the Danger zone tab at the bottom of the menu, and clicking the red Delete project button, shown below.
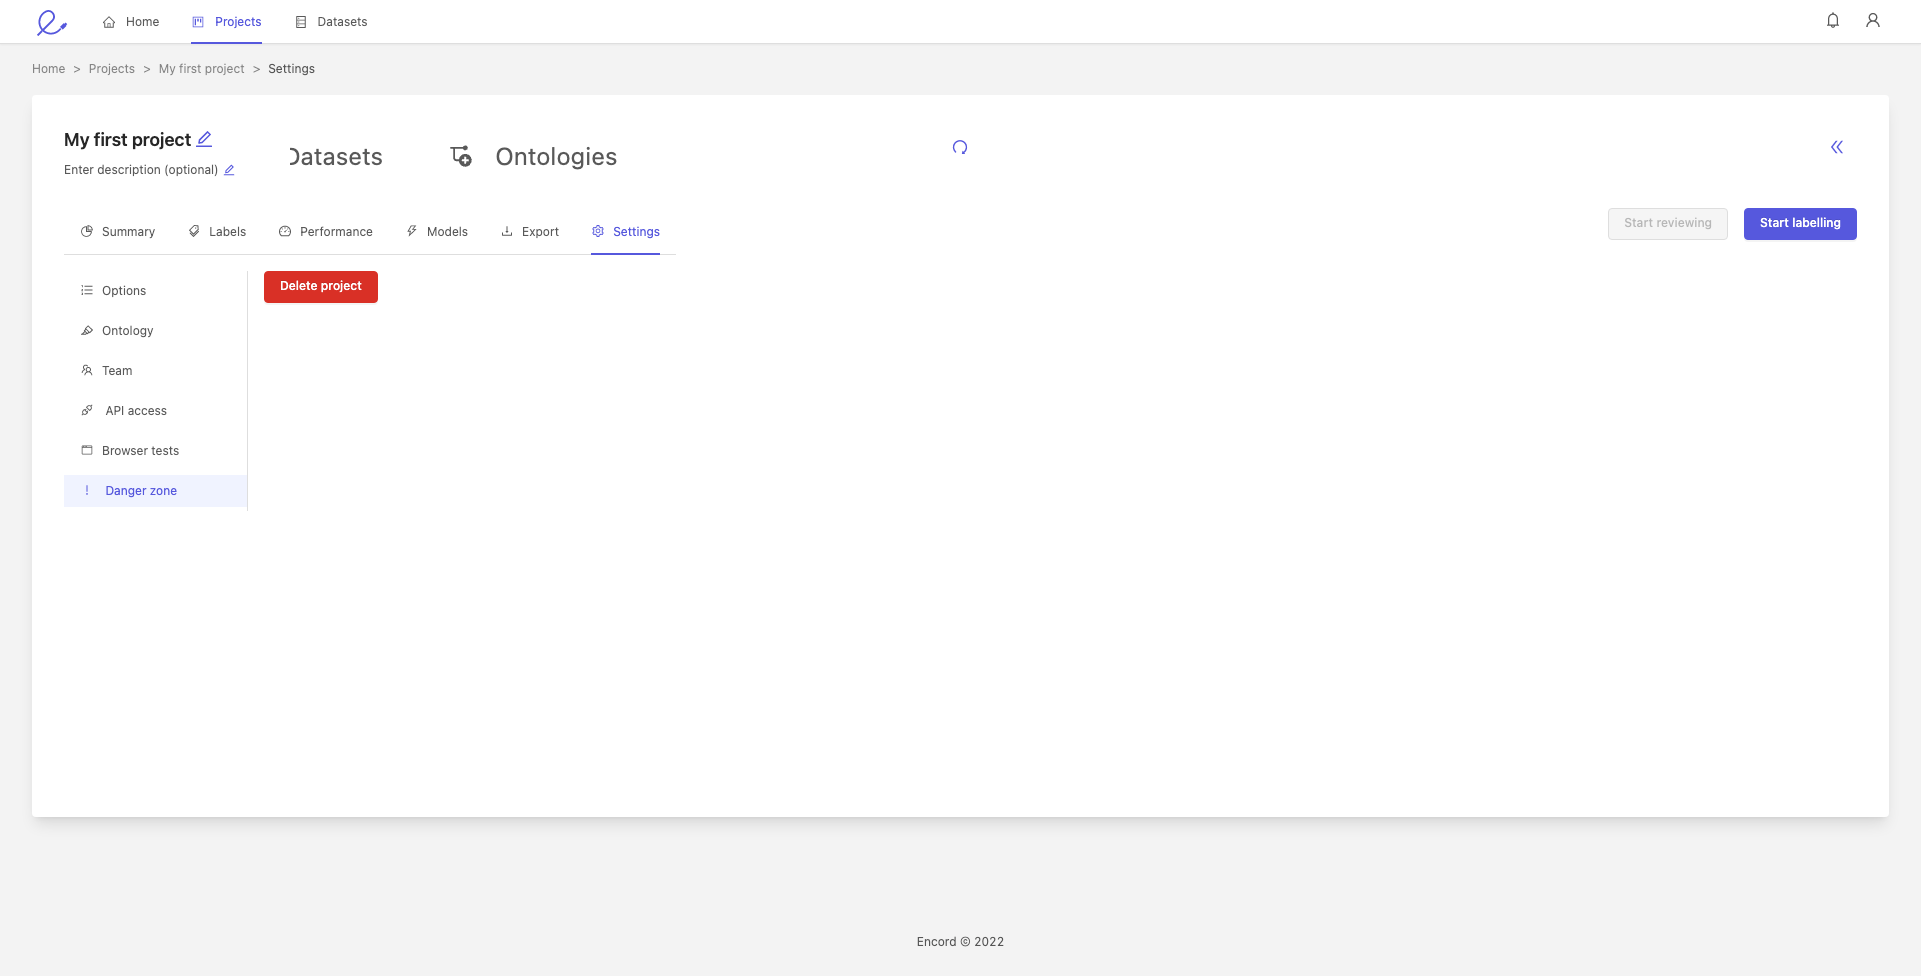
Deleting your project does not delete the datasets in the project, but will delete the project's labels and ontology.
Updated 14 days ago