Overview Shortcuts and Prediction Types
Overview shortcuts for Data, Labels, and Predictions and Prediction Types for Predictions, give you a quick method to filter your unwanted or problematic images. They are shortcuts to improving datasets and model performance. They give you a quick launch pad to improve your data and your model performance.
Note
The overview shortcuts for Data, Labels, and Predictions in the Overview tab are generalized. Contact us if you want personalized shortcuts populating the Overview tab.
Data Issue Shortcuts
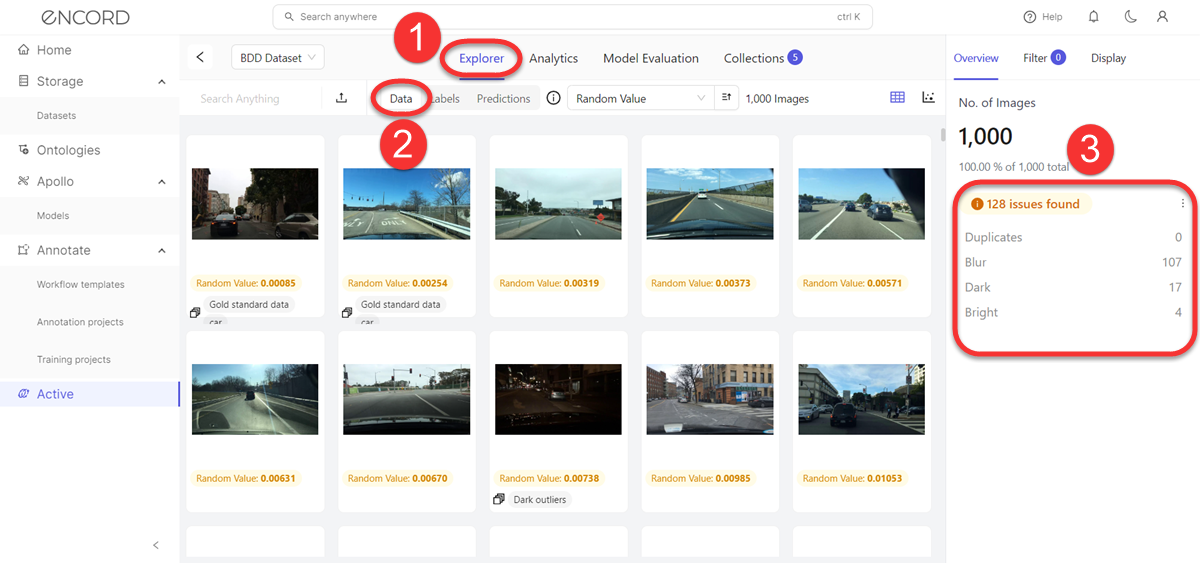
Data Issues Overview
| Title | Metric Type | Ontology Type |
|---|---|---|
| Duplicates - Duplicate and near-duplicate images. Images with a Uniqueness score of 0.0 to 0.00001 are flagged as duplicates. | image | |
| Blur - Images that are too blurry. Images with a Sharpness score of 0.0 to 0.005 are flagged as blurry. | image | |
| Dark - Images that are too dark. Images with a Brightness score of 0.0 to 0.1 are flagged as too dark. | image | |
| Bright - Images that are too bright. Images with a Brightness score of 0.7 to 1.0 are flagged as too bright. | image |
Label Issue Shortcuts
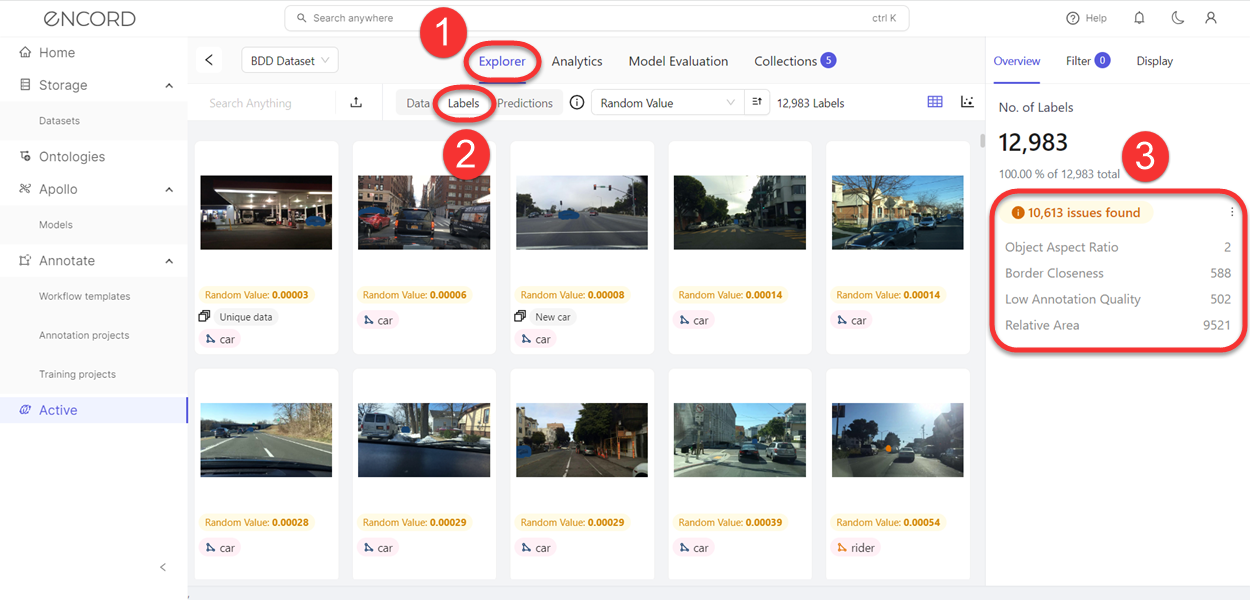
Label Issues Overview
| Title | Metric Type | Ontology Type |
|---|---|---|
| Aspect Ratio - Identifies objects with a low aspect ratio value. Images with an Aspect Ratio score of 0.0 to 0.1 are flagged as having an issue. | image | bounding box, polygon, rotatable bounding box |
| Border Proximity - Identifies annotations that are too close to image borders. Images with a Border Proximity score of 1 are flagged as being too close to the border. | image | bounding box, point, polygon, polyline, rotatable bounding box, skeleton |
| Low Annotation Quality - Compares image classifications against the 60 most similar images. Images with a Classification Quality score of 0.0 to 0.02 are flagged as having an issue. | image | radio |
| Relative Area - Identifies annotations that are relatively too small compared to the size of the image. Images with a Relative Area score of 0.0 to 0.003 are flagged being too small. | image | bounding box, polygon, rotatable bounding box |
Prediction Issues and Types
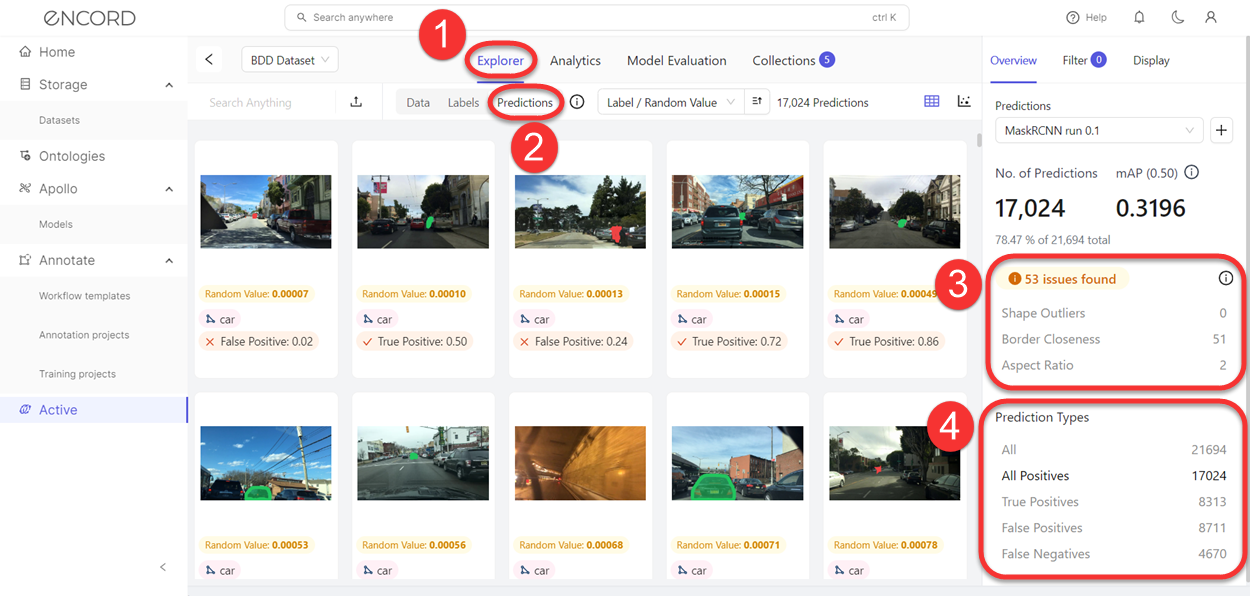
Prediction Issues Overview
| Title | Metric Type | Ontology Type |
|---|---|---|
| Shape Outliers - Duplicate and near-duplicate images. Images with a Polygon Shape Anomaly score of 0.0 to 0.02 are flagged as duplicates. | image | |
| Border Proximity - Identifies annotations that are too close to image borders. Images with a Border Proximity score of 1 are flagged as being too close to the border. | image | bounding box, point, polygon, polyline, rotatable bounding box, skeleton |
| Aspect Ratio - Identifies objects with a low aspect ratio value. Images with an Aspect Ratio score of 0.0 to 0.1 are flagged as having an issue. | image | bounding box, polygon, rotatable bounding box |
Prediction Types
| Title | Metric Type | Ontology Type |
|---|---|---|
| All - All model outcomes. | image | |
| All Positives - All model outcomes that are True Positive and False Positive. | image | |
| True Positives - All model outcomes where the model correctly identified objects. | image | |
| False Positives - All model outcomes where the model incorrectly identified objects as the correct object. | image | |
| False Negatives - All model outcomes where the model incorrectly identified objects as the wrong object. | image |
Use Issue and Prediction Type shortcuts
This process assumes that there is already one or more Projects in Active.
To use Issue and Prediction Type shortcuts:
-
Log in to the Encord platform.
The landing page for the Encord platform appears. -
Click Active in the main menu.
The landing page for Active appears. -
Click the Project.
The landing page for the Project appears with the Explorer tab selected. -
Click Data, Labels, or Predictions.
The Explorer workspace changes based on what you clicked. The Overview tab displays with the shortcuts. -
Click a shortcut.
A filter is applied to the images. The images appearing in the Explorer workspace changes depending on which shortcut you click. -
Click Filter if you want to modify the filter settings.
-
Further search, sort, and filter the data.
-
Create a Collection based on the results.
-
Create a Dataset (and Project) and send that Dataset to Annotate.
-
Further annotate your data.
-
Rinse and repeat until you have the dataset you need for optimal model performance.
Updated about 2 months ago