Model quality metrics
Model quality metrics help you evaluate your data and labels based on a trained model and imported model predictions.
Acquisition functions
Acquisition functions are a special type of model quality metric, primarily used in active learning to score data samples according to how informative they are for the model and enable smart labeling of unannotated data.
| Title | Metric Type | Data Type |
|---|---|---|
| Entropy - Rank images by their entropy. | image | |
| LeastConfidence - Rank images by their least confidence score. | image | |
| Margin - Rank images by their margin score. | image | |
| Variance - Rank images by their variance. | image | |
| MeanObjectScore - Rank images by their average object score | image | object |
Entropy
Rank images by their entropy.
It can be employed to define a heuristic that measures a model’s uncertainty about the classes in an image using the average of the entropies of the model-predicted class probabilities in the image. Like before, the higher the image's score, the more “confused” the model is. As a result, data samples with higher entropy score should be offered for annotation.
Metric details
The mathematical formula of entropy is:
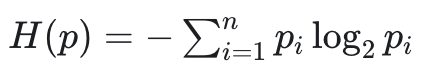
In information theory, the entropy of a random variable is the average level of “information”, “surprise”, or “uncertainty” inherent to the variable's possible outcomes. The higher the entropy, the more “uncertain” the variable outcome.
Implementation on GitHub.
Least Confidence
Rank images by their least confidence score. Least confidence takes the difference between 1 (100% confidence) and the most confidently predicted label for each item. It's useful to convert the uncertainty scores to a 0–1 range, where 1 is the most uncertain score.
It can be employed to define a heuristic that measures a model’s uncertainty about the classes in an image using the average of the LC score of the model-predicted class probabilities in the image. Like before, the higher the image's score, the more “confused” the model is. As a result, data samples with higher LC score should be offered for annotation.
Metric details
The mathematical formula of the LC score of a model's prediction is:
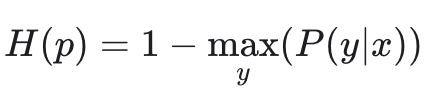
The Least confidence (LC) score of a model's prediction is the difference between 1 (100% confidence) and its most confidently predicted class label. The higher the LC score, the more “uncertain” the prediction.
Implementation on GitHub.
Margin
Rank images by their margin score.
It can be employed to define a heuristic that measures a model’s uncertainty about the classes in an image using the average of the margin score of the model-predicted class probabilities in the image. Like before, the lower the image's score, the more “confused” the model is. As a result, data samples with lower margin score should be offered for annotation.
Metric details
Margin score of a model's prediction is the difference between the two classes with the highest probabilities. The lower the margin score, the more “uncertain” the prediction.
Implementation on GitHub.
Variance
Rank images by their variance.
It can be employed to define a heuristic that measures a model’s uncertainty about the classes in an image using the average of the variance of the model-predicted class probabilities in the image. Like before, the lower the image's score, the more “confused” the model is. As a result, data samples with lower variance score should be offered for annotation.
Metric details
The mathematical formula of variance of a data set is:
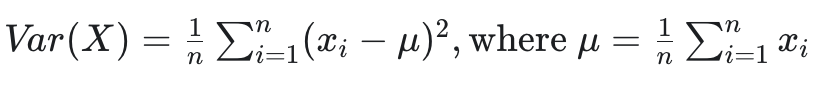
Variance is a measure of dispersion that takes into account the spread of all data points in a data set. The variance is the mean squared difference between each data point and the centre of the distribution measured by the mean. The lower the variance, the more “clustered” the data points.
Implementation on GitHub.
Mean object confidence
This method ranks images based on the mean score of their predicted objects, applicable specifically for object-level predictions such as bounding-box or segmentation.
A lower score indicates that the model's predictions for an image lack certainty. This measurement is particularly effective in scenarios where the presence of at least one object is anticipated in every image.
Metric details
The metric calculates the maximum confidence score for each class within every object-level prediction, averages these across all object predictions within an image, and assigns this average as the image's score. In the absence of any predictions for an image, a score of zero is assigned.
Updated 4 months ago