Annotation Projects
Creating annotation projects
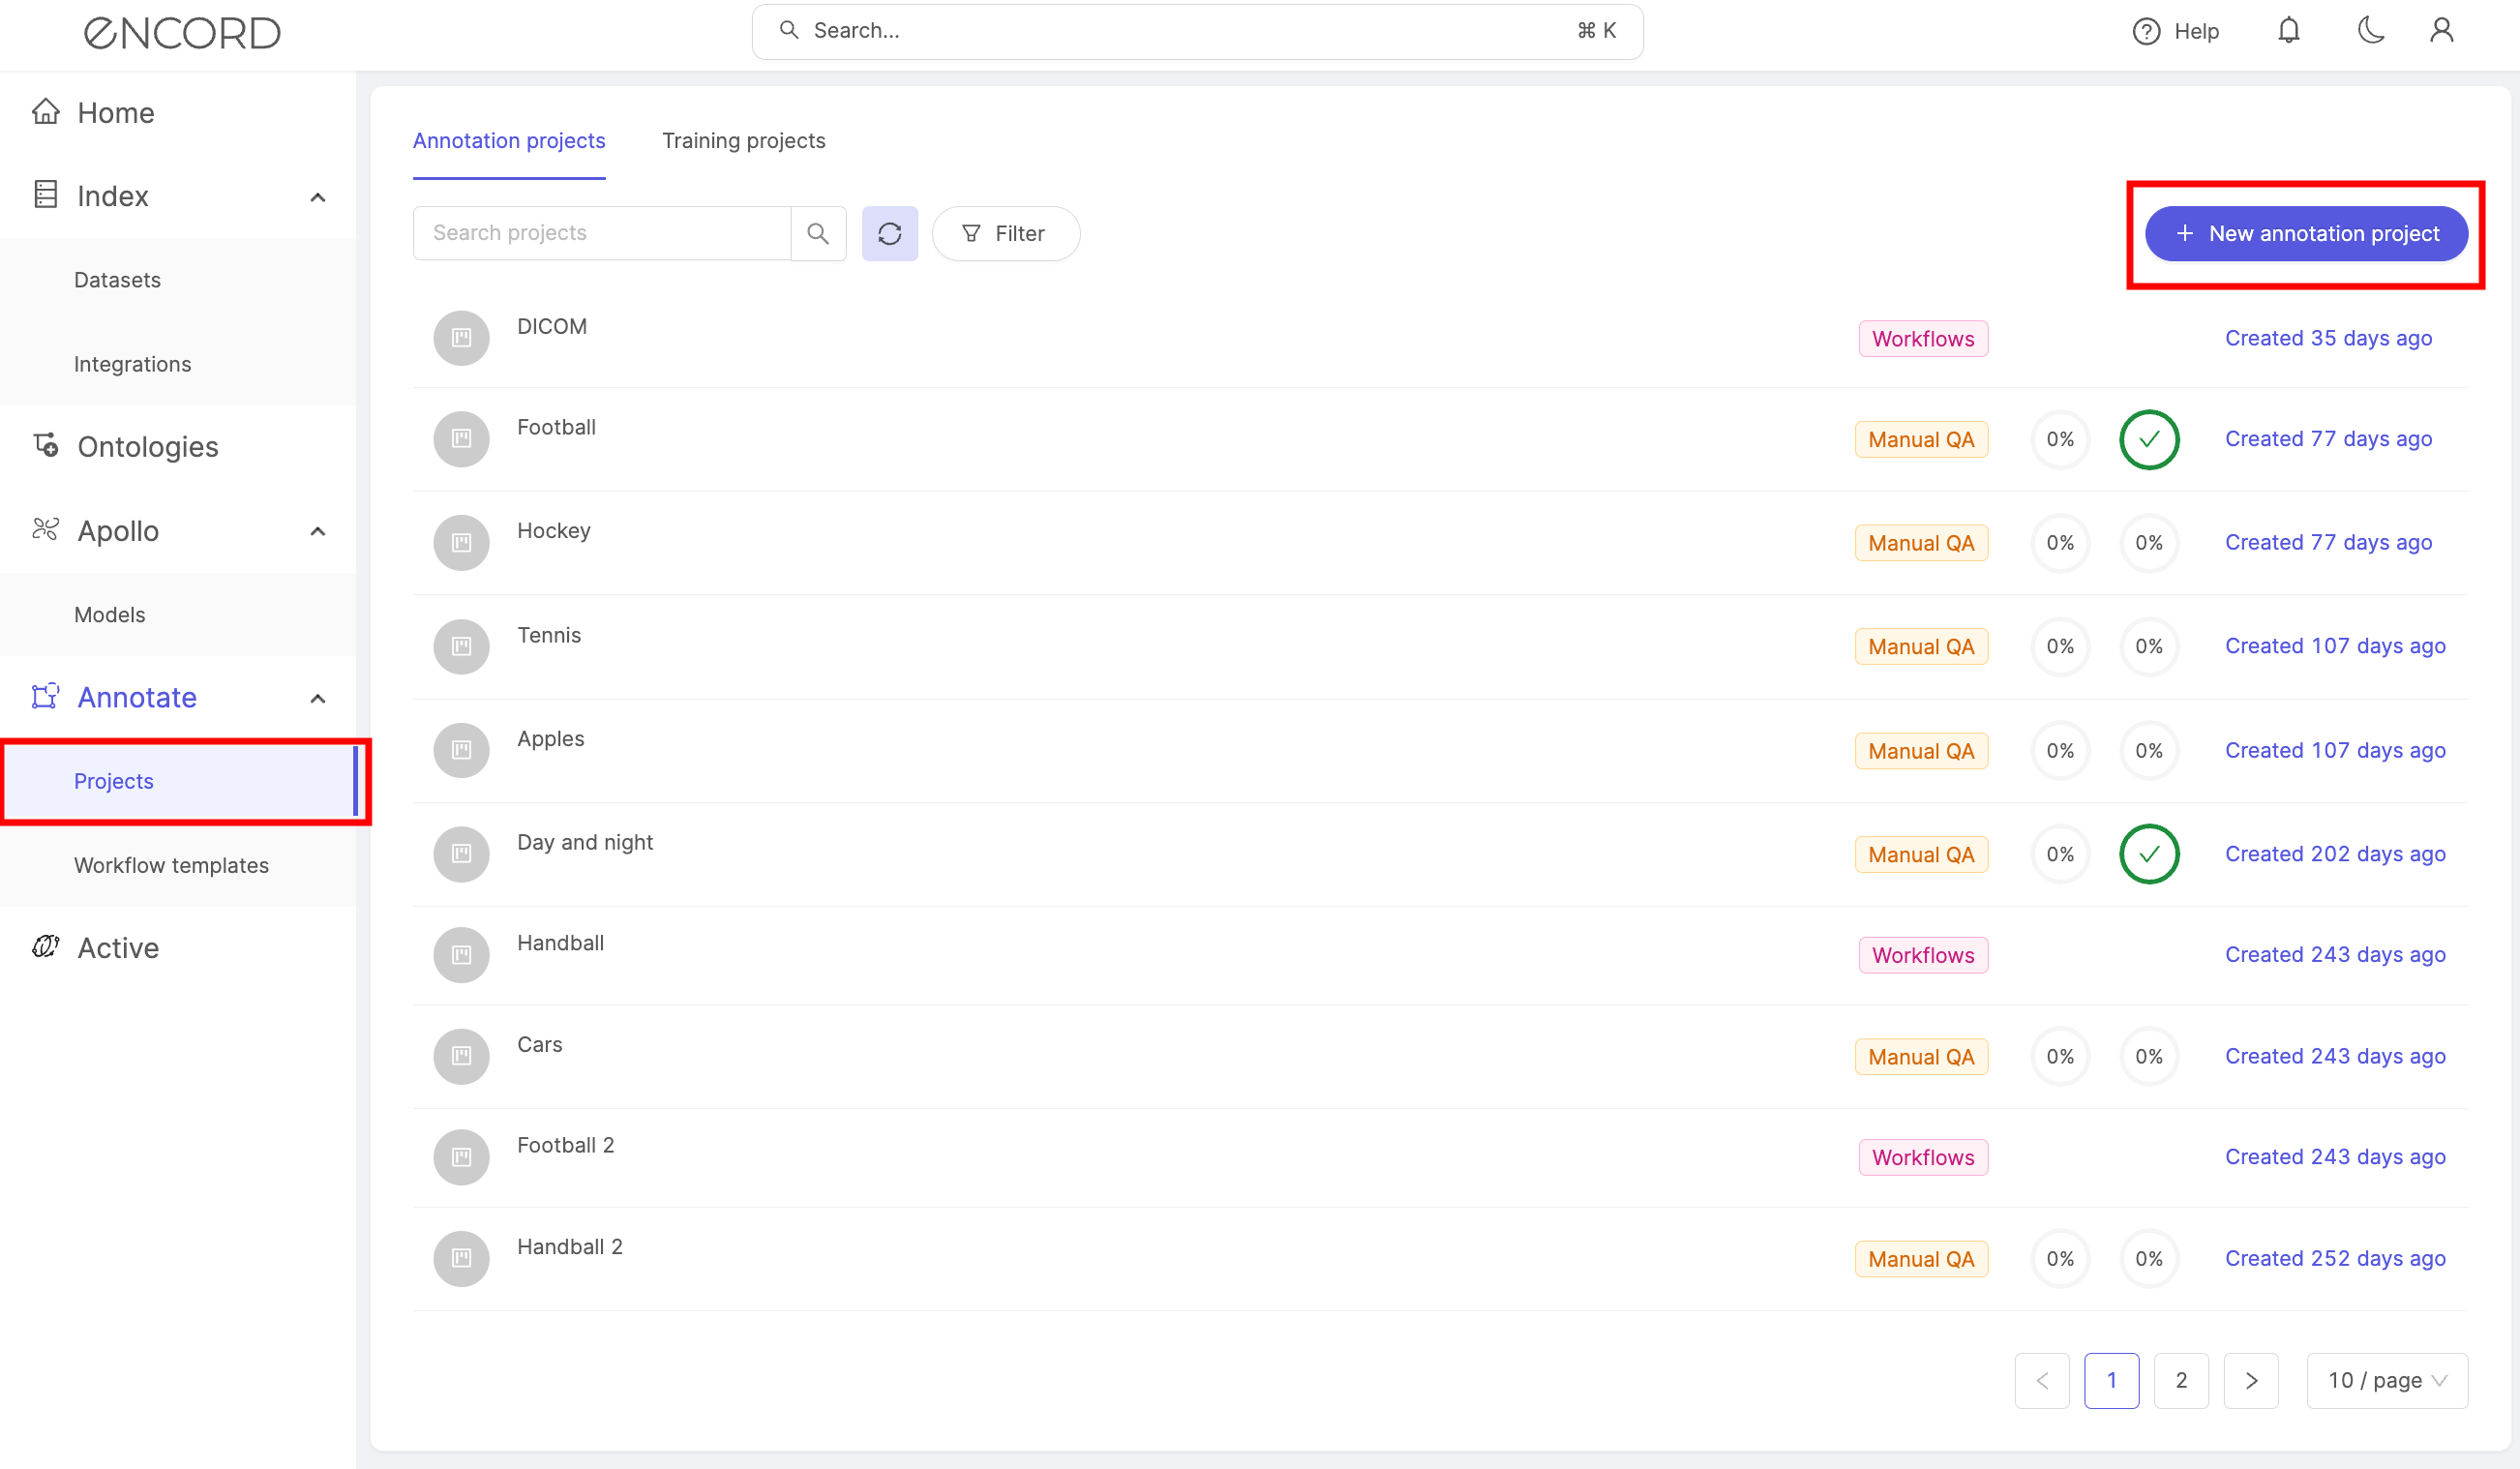
- In the Encord platform, select Projects under Annotate.
- Click the + New annotation project button to create a new Project.
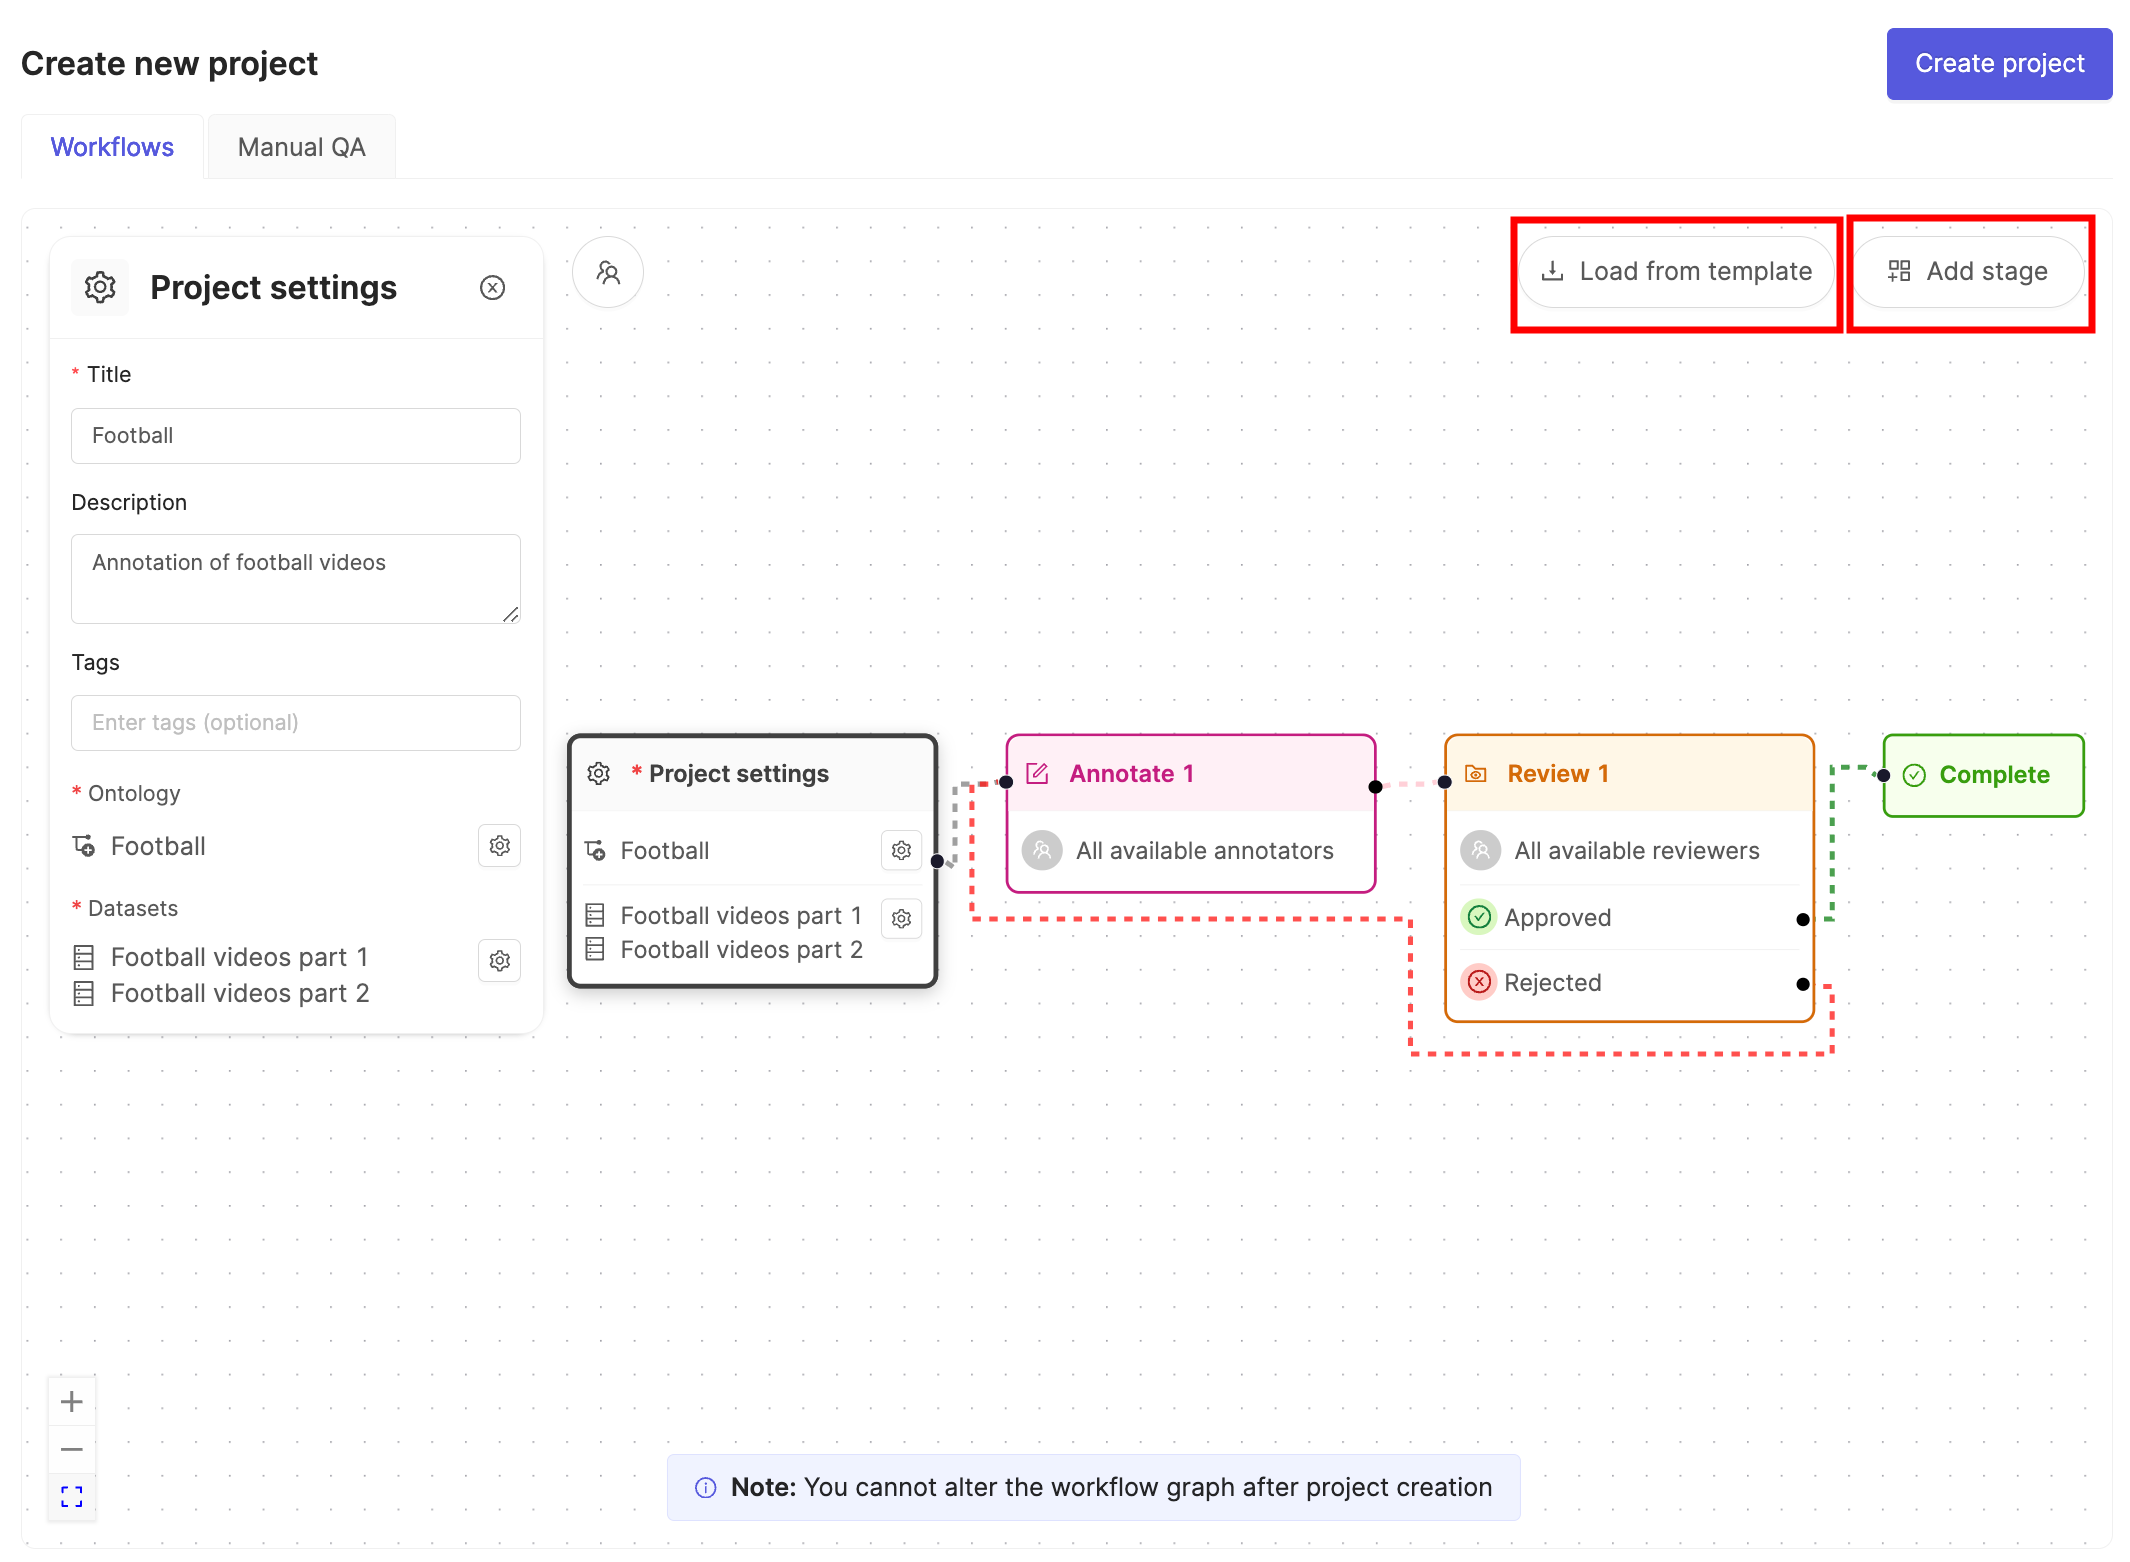
1. Project settings
Note
You can create Manual QA Projects by selecting the Manual QA tab.
Provide a meaningful Project title and description.
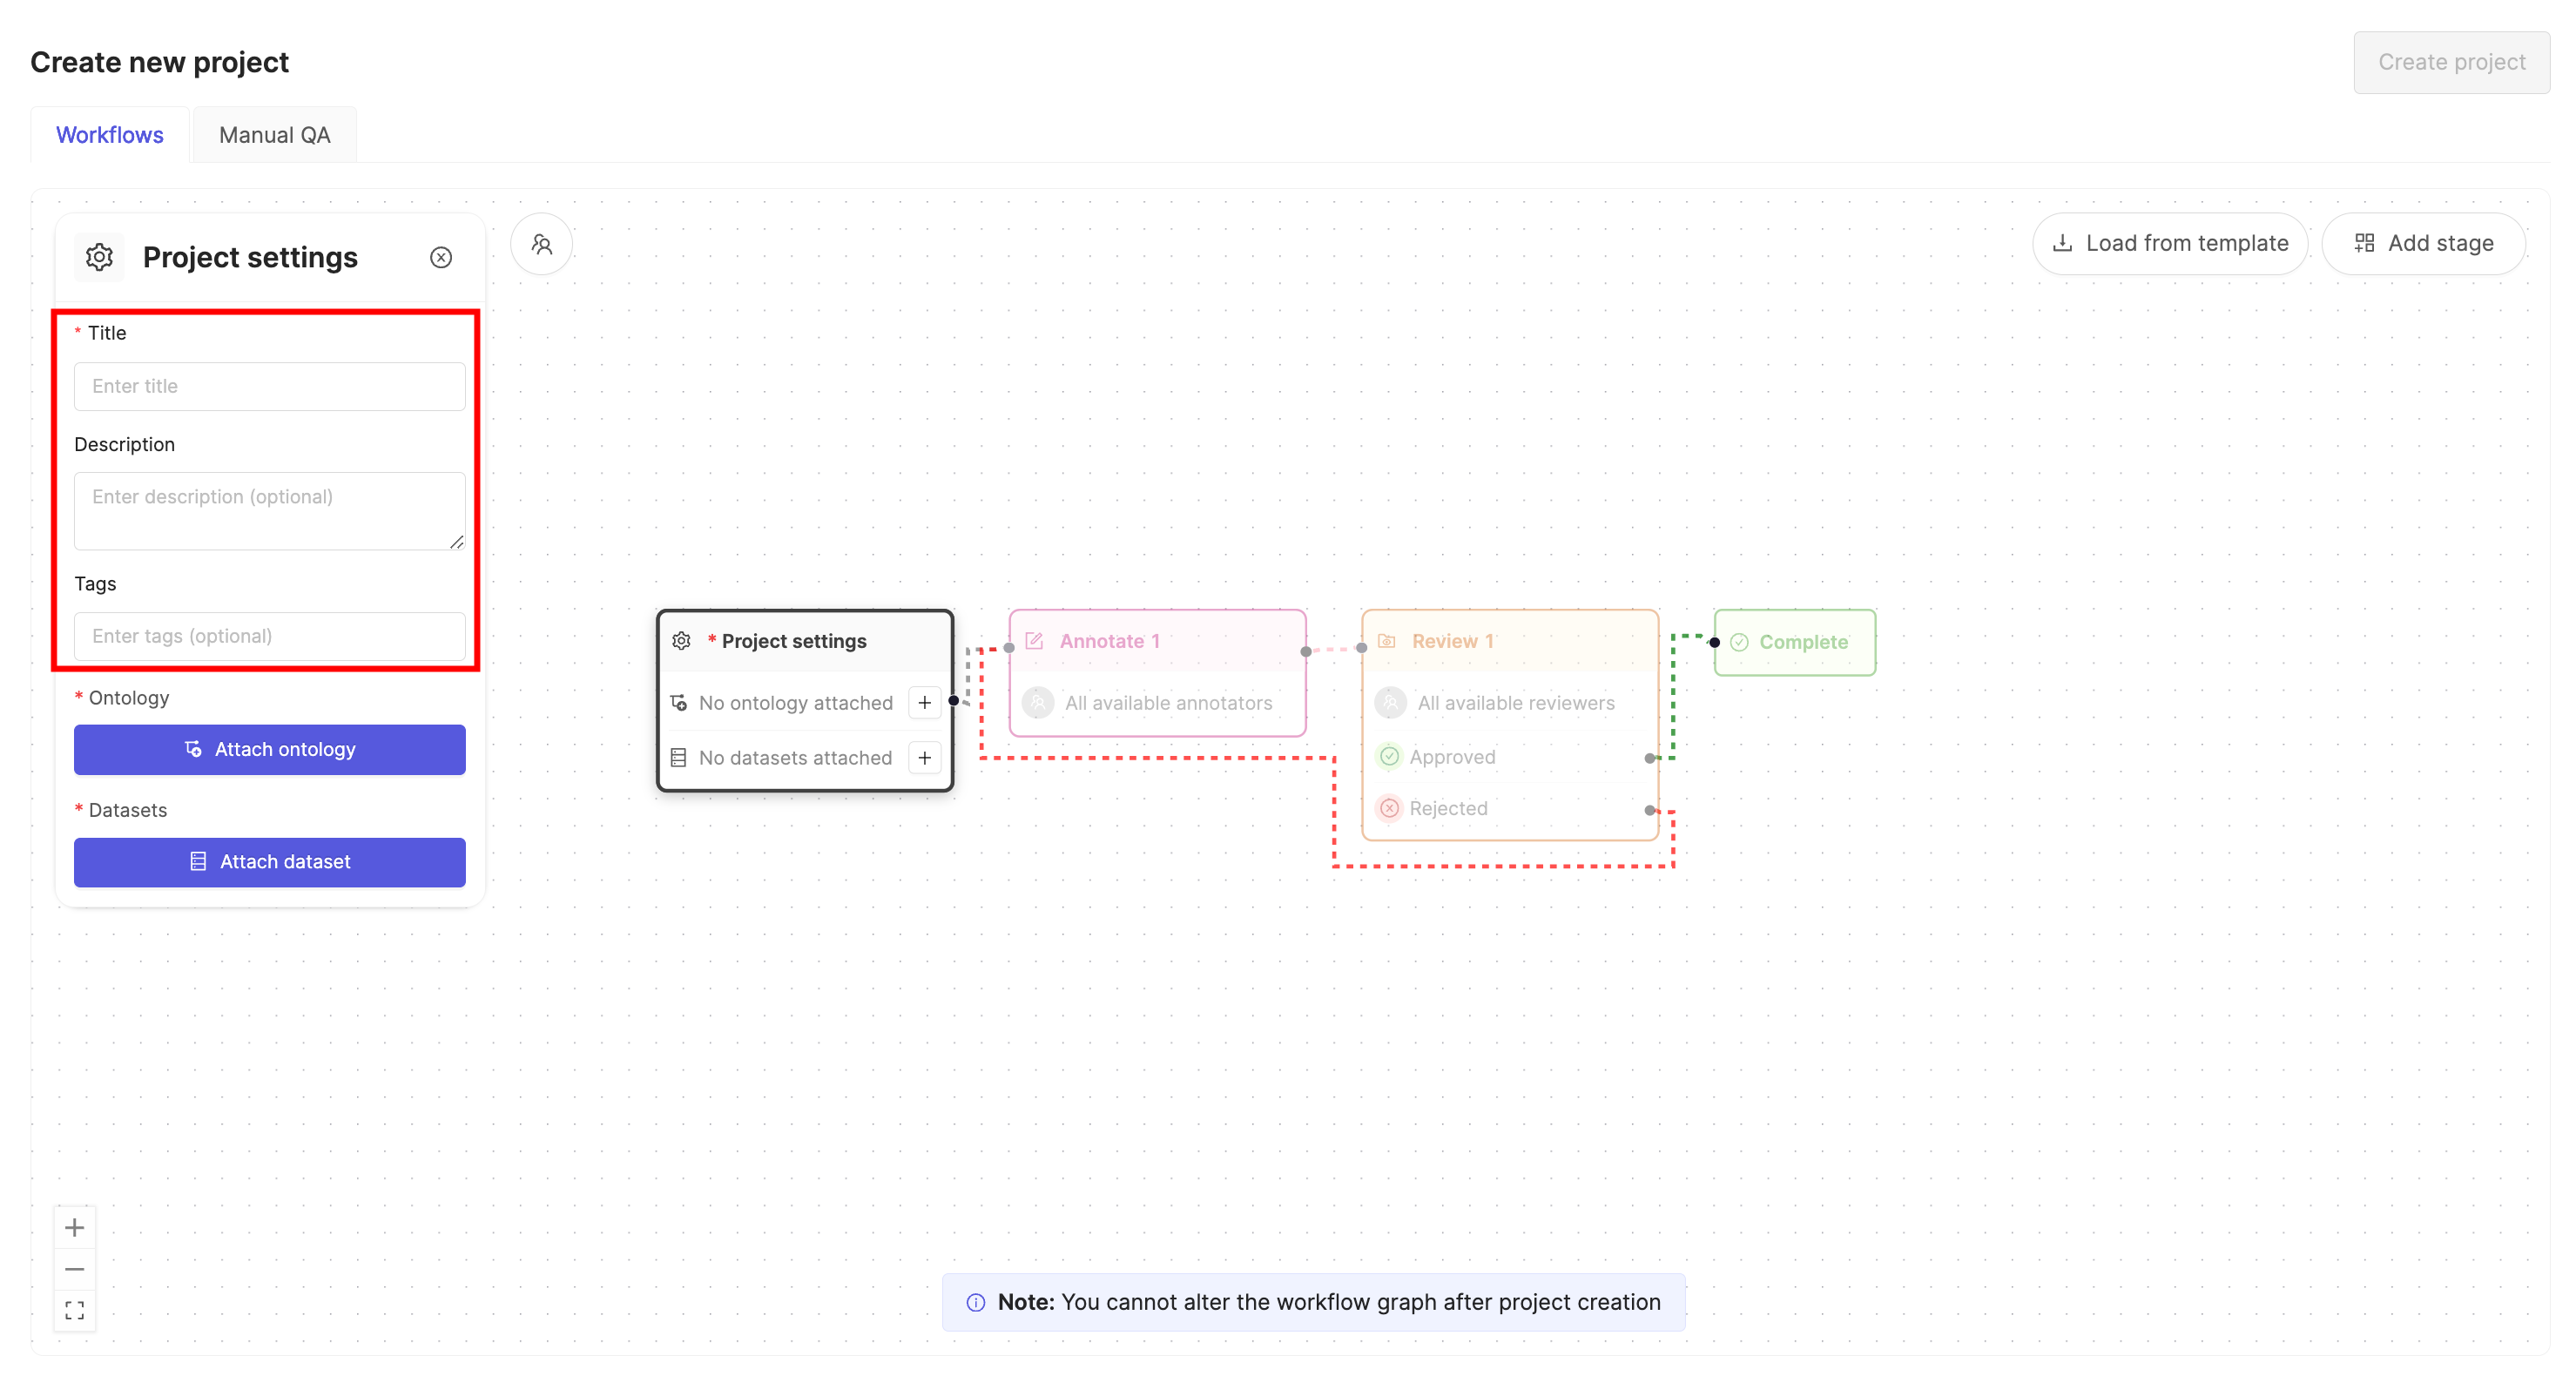
If you are part of an organization, an optional project tags drop-down is visible. Project tags are useful for categorizing and finding your projects. Select as many tags as are relevant to your project.
2. Attach Ontology and Datasets
A Project requires an Ontology to define the labels being applied, and at least one Dataset to determine what is being labeled.
Note
DICOM customers might be more familiar with the term 'labeling protocol', which is equivalent to an Ontology.
Attach Ontology
Click the Attach ontology button.
Select an existing Ontology from the list using the Select button, or create a new Ontology by clicking the New ontology button.
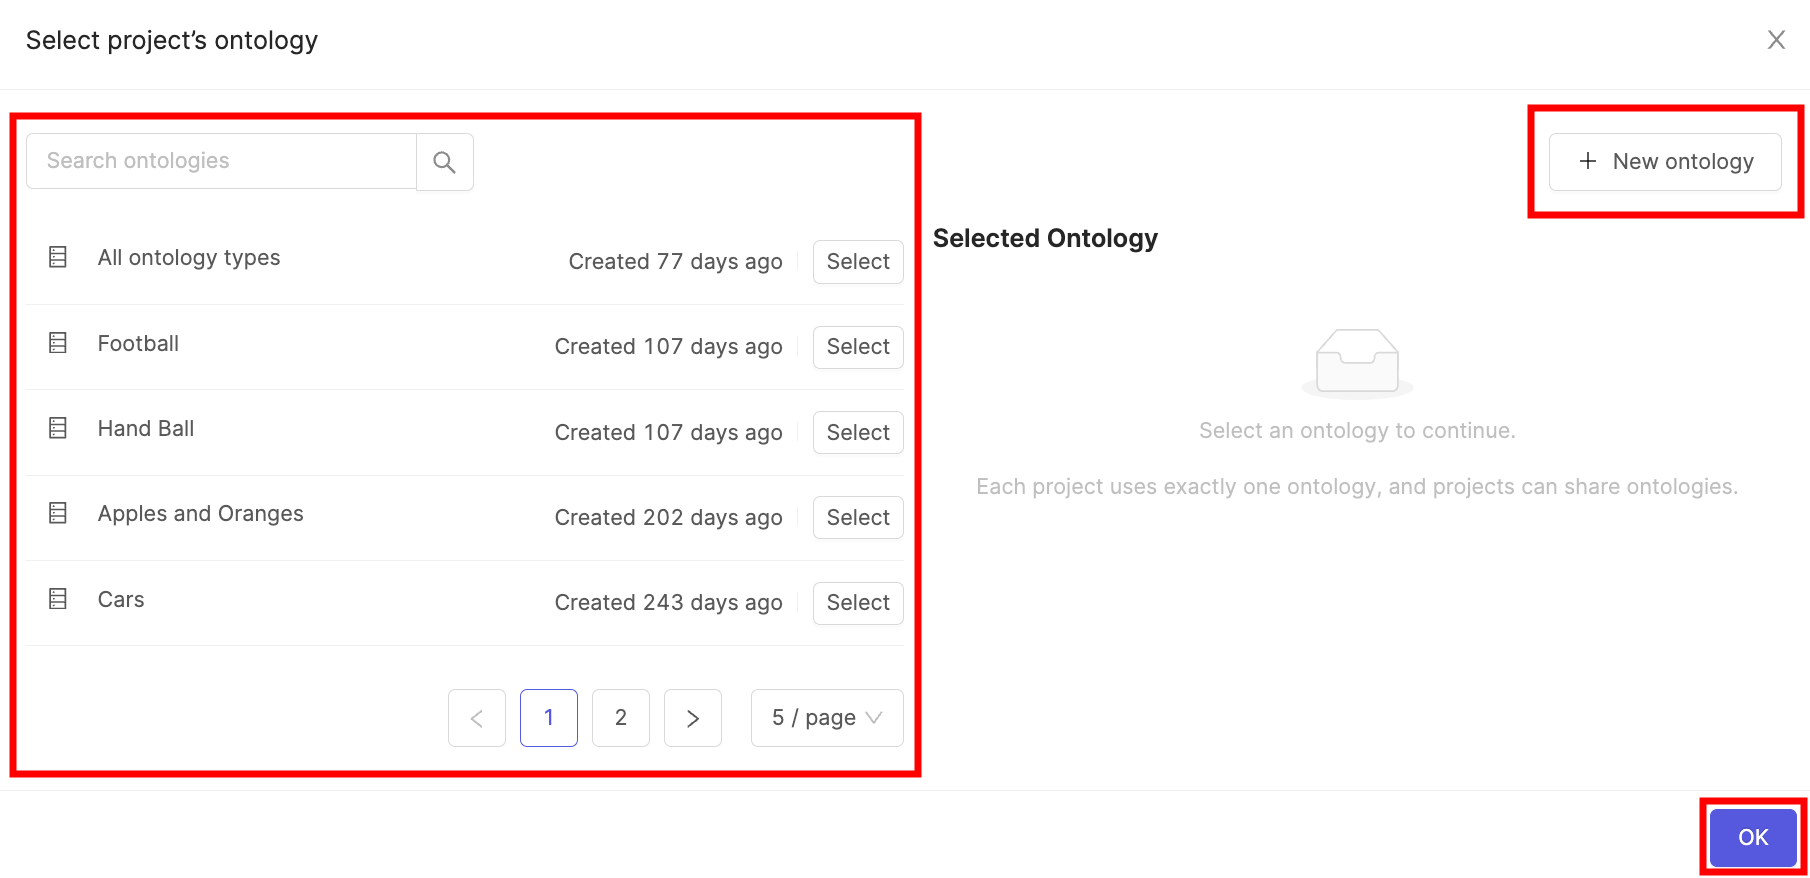
Click OK to attach the Ontology to the Project.
Attach Datasets
Click the Attach datasets button.
Select an existing Dataset from the list using the Attach button, or create a new Dataset by clicking the New Dataset button.
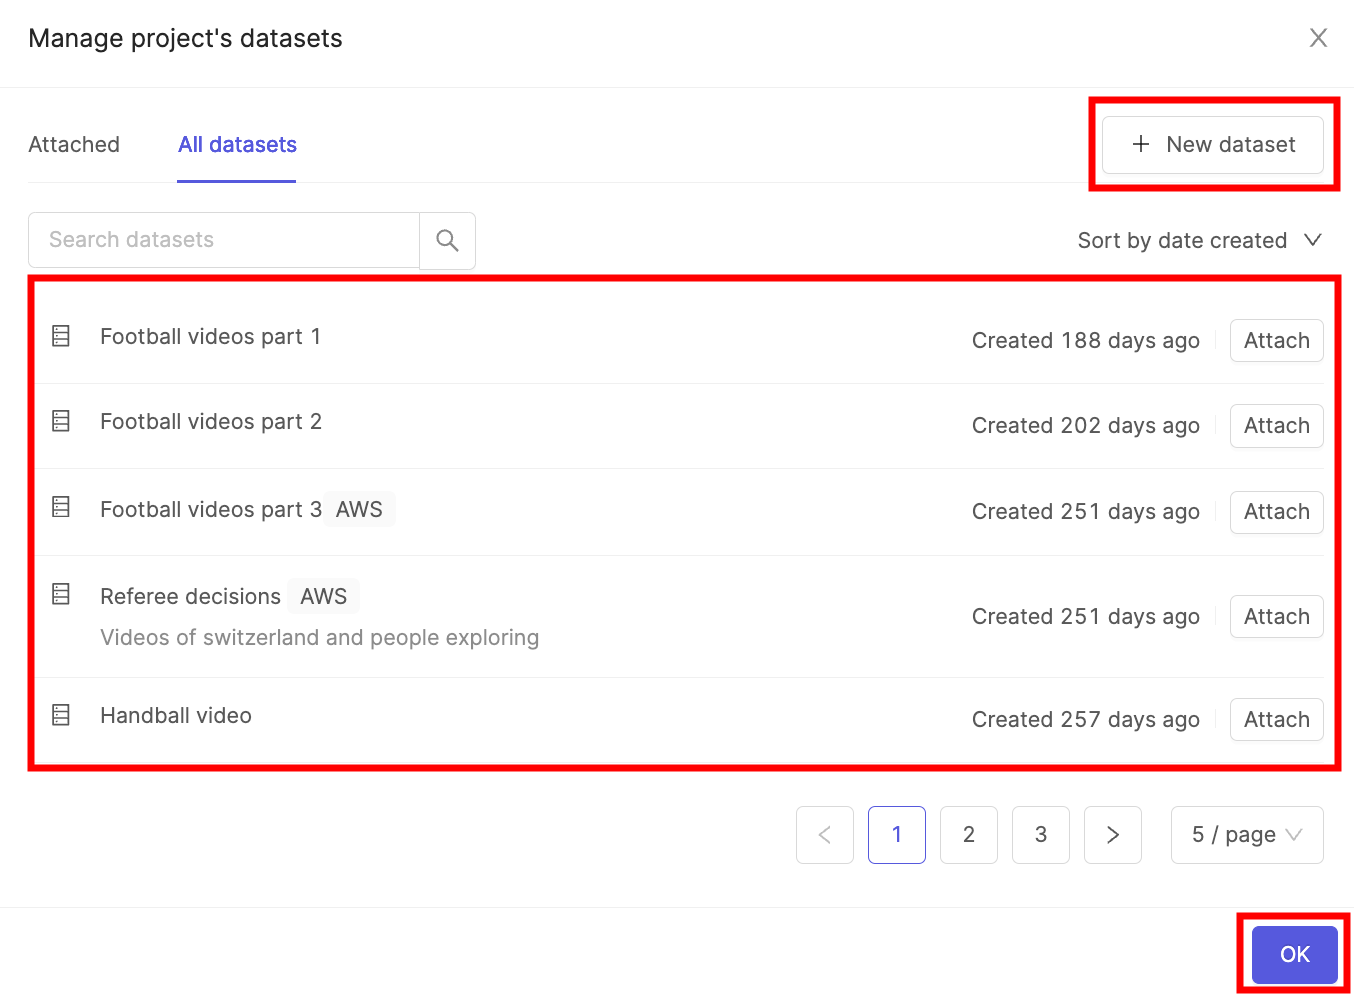
Click OK to attach the Dataset(s) to the Project.
3. Select Workflow
The Workflow determines how tasks move through your Project from annotation to completion. A simple Workflow containing one Annotation stage and one Review stage is provided by default.
Select a Workflow template
Click the Load from template button, to use an existing Workflow template, .
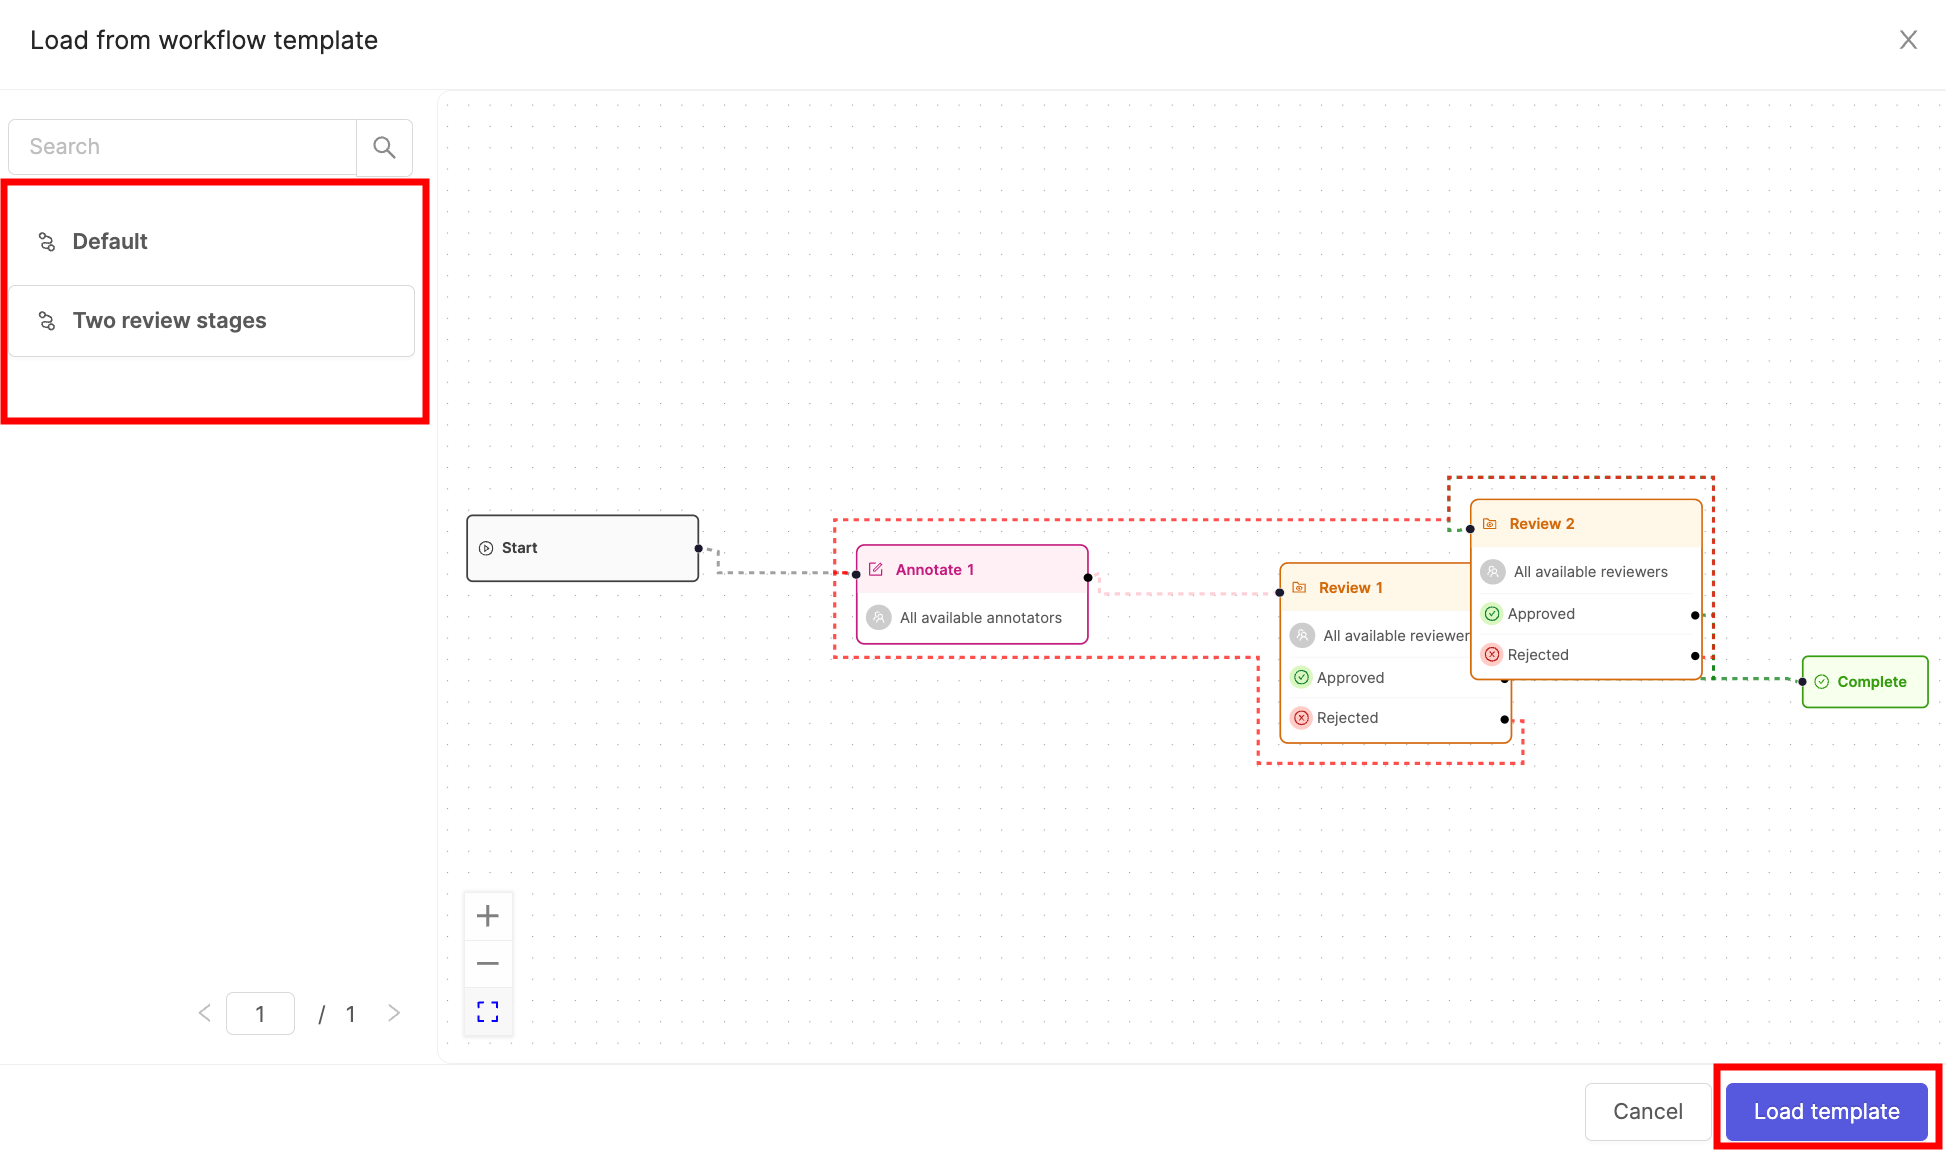
Select the template you want to use and click Load template to use it for this Project.
Creating a new Workflow
To modify the default Workflow shown on the canvas, click Add stage.
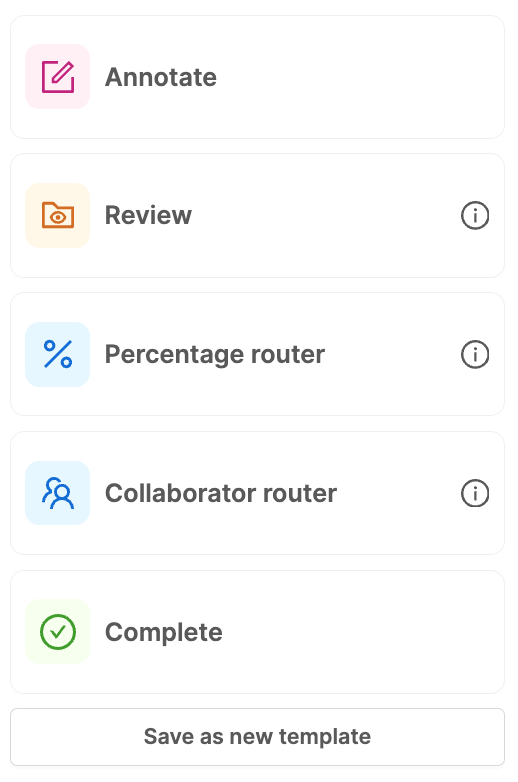
Drag-and-drop components onto the canvas. See our documentation on Workflows for more details.
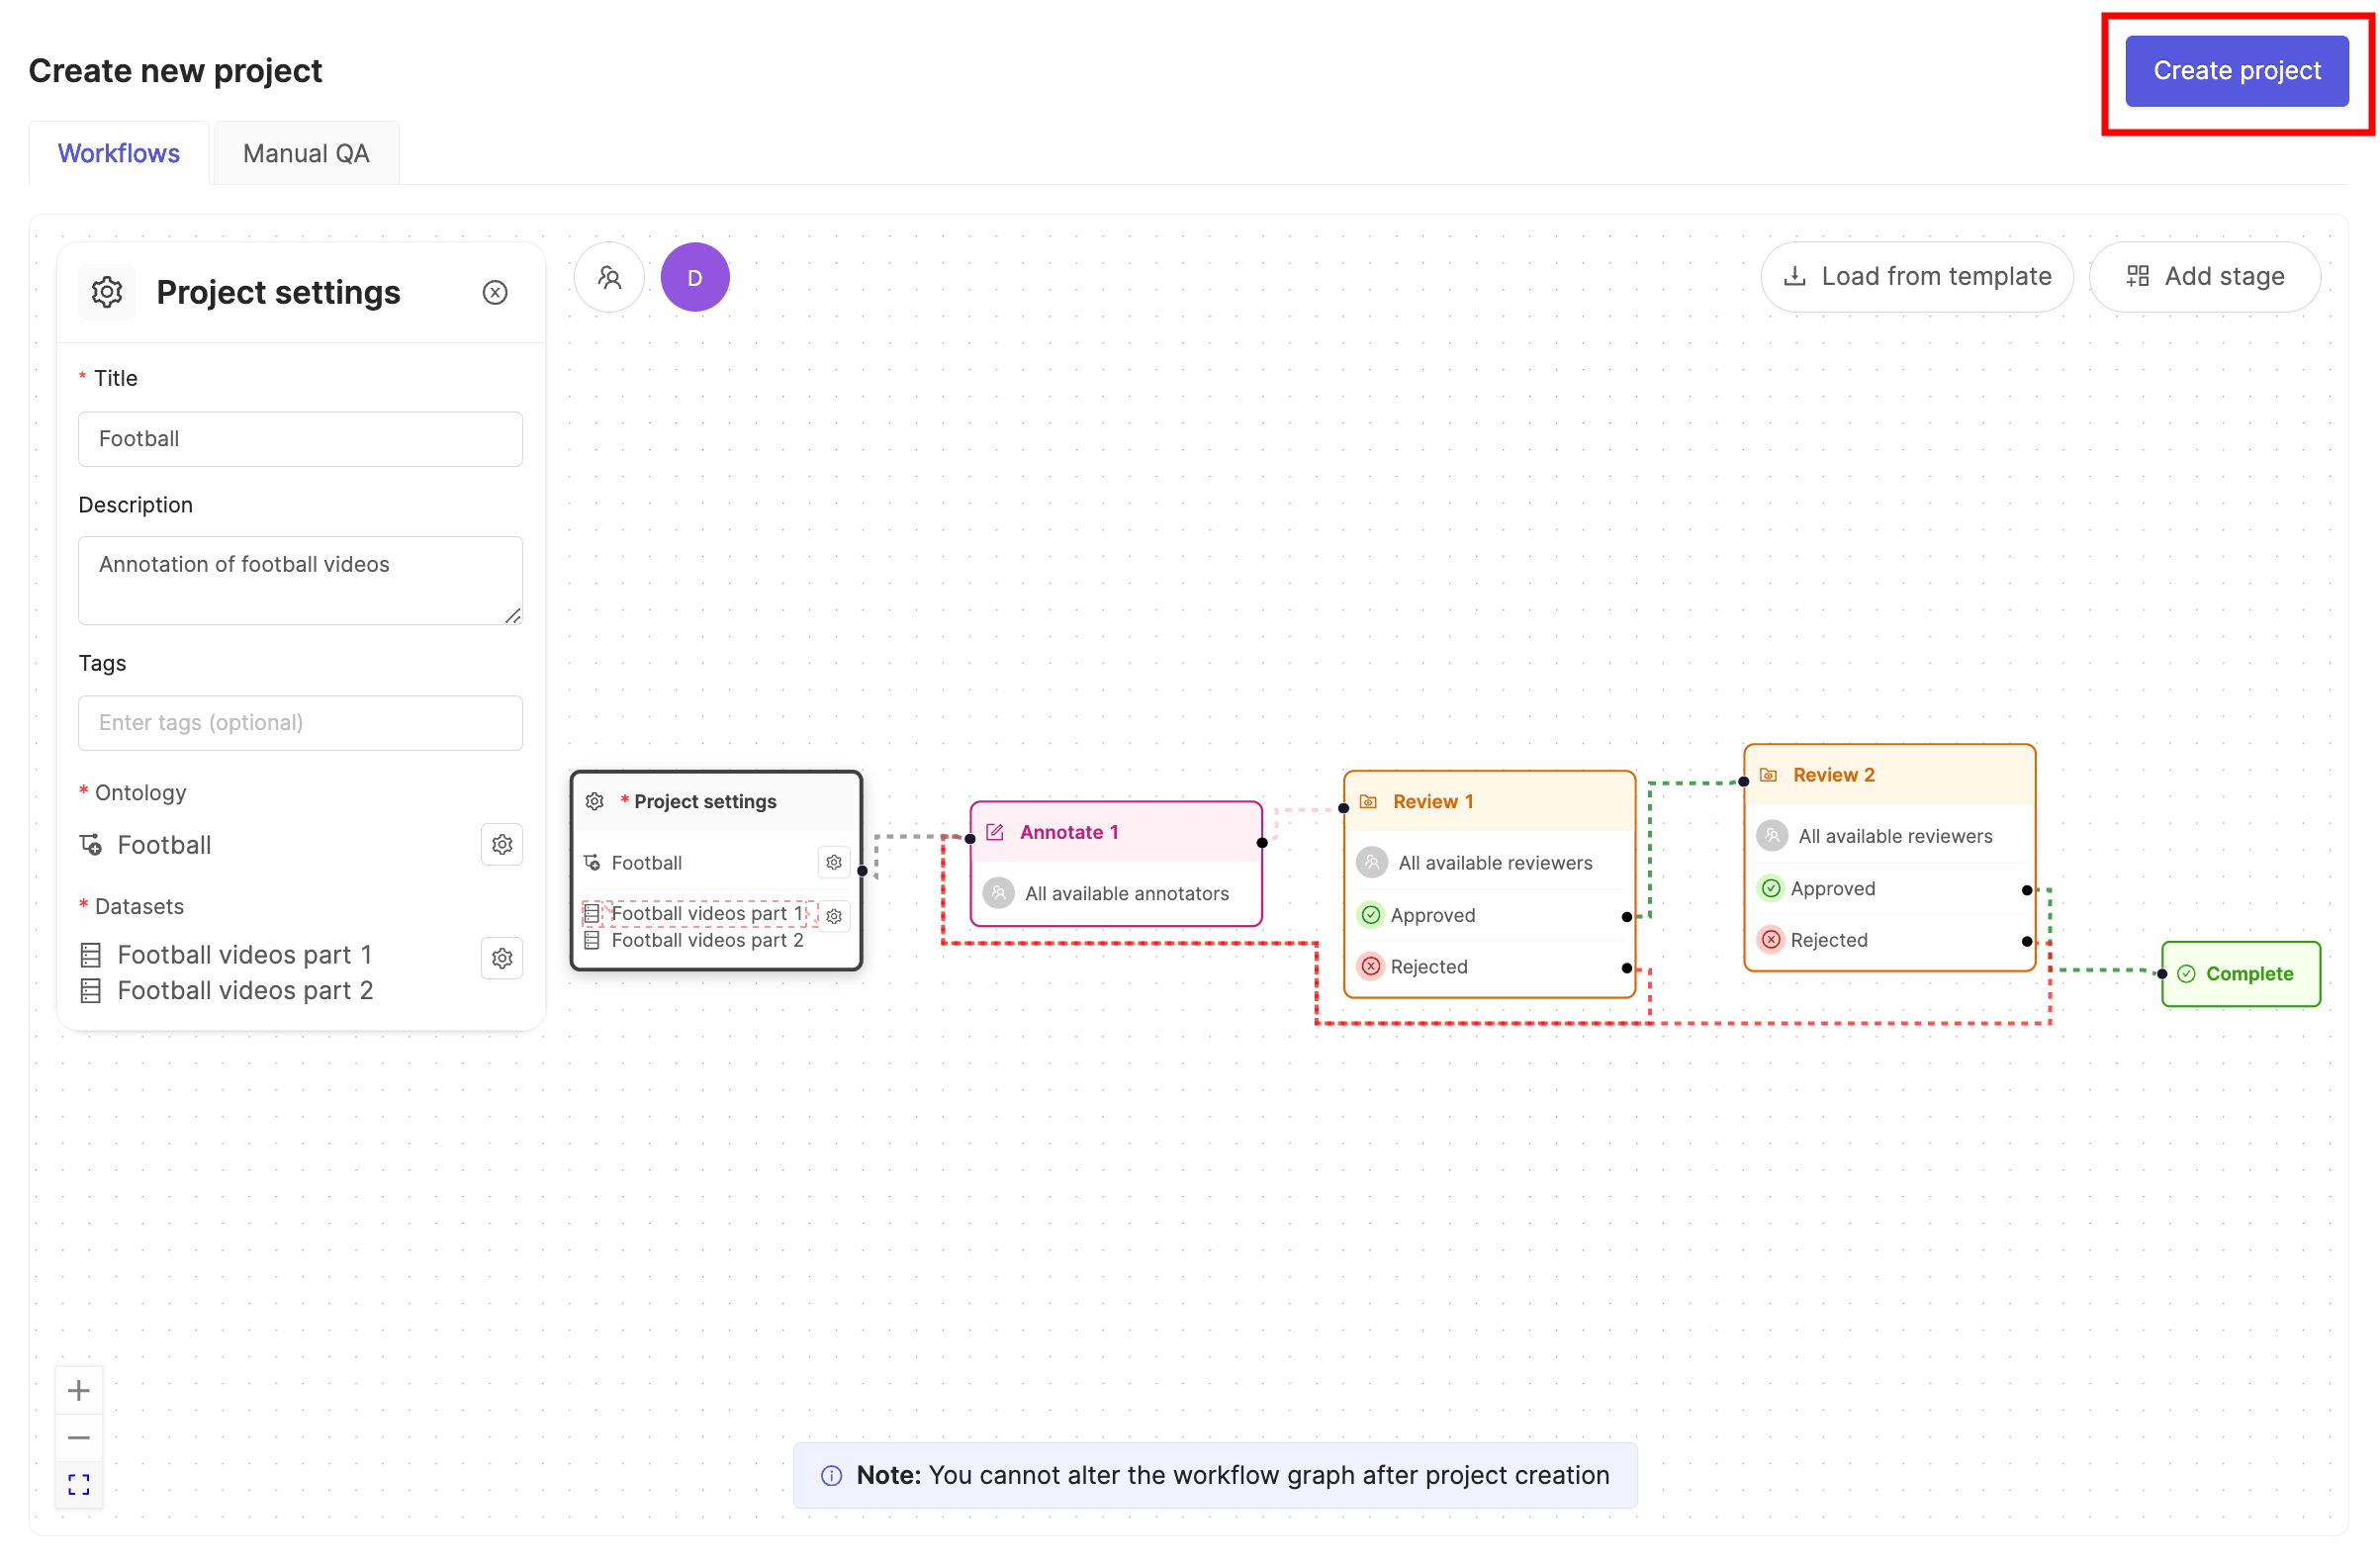
4. Create Project
After attaching Datasets and an Ontology, and determining the Project's Workflow, the Project is ready. Click Create project to complete the process.
Note
You can create Manual QA projects by selecting the Manual QA tab.
Working with annotation Projects
- In the Encord platform, select Projects under Annotate.
- Select the Project you want to Administer.
Project dashboard
The first thing you see when you click on your Project is the Project dashboard.
This is where you monitor and manage your Project - view your Project's summary statistics, manage labeling tasks, view your team's productivity, train models and invite collaborators.
The dashboard is split into 7 tabs:
- Summary: a high-level view of labeling and productivity statistics.
- Explore: a quick way to explore the distribution of instances and labels across data assets in the
project. - Labels: for managing all the project's labeling activity and tasks.
- [Performance]: a more detailed view of your team's manual labeling and productivity split into a Summary and Details tab.
- Models: for creating, training and using pre-trained computer vision models with your labeled training data.
- Settings: editing Project options, ontology, team collaborators, and other general project settings.
Certain tabs can only be accessed by specific users roles.
| Tab | Annotator | Reviewer* | Annotator + Reviewer* | Team Manager | Admin |
|---|---|---|---|---|---|
| Summary | ✅ | ✅ | ✅ | ✅ | ✅ |
| Explore | ❌ | ❌ | ❌ | ✅ | ✅ |
| Labels | ✅ | ✅ | ✅ | ✅ | ✅ |
| Performance | ❌ | ❌ | ❌ | ✅ | ✅ |
| Models | ❌ | ❌ | ❌ | ✅ | ✅ |
| Export | ❌ | ❌ | ❌ | ❌ | ✅ |
| Settings | ❌ | ❌ | ❌ | ✅ | ✅ |
Summary
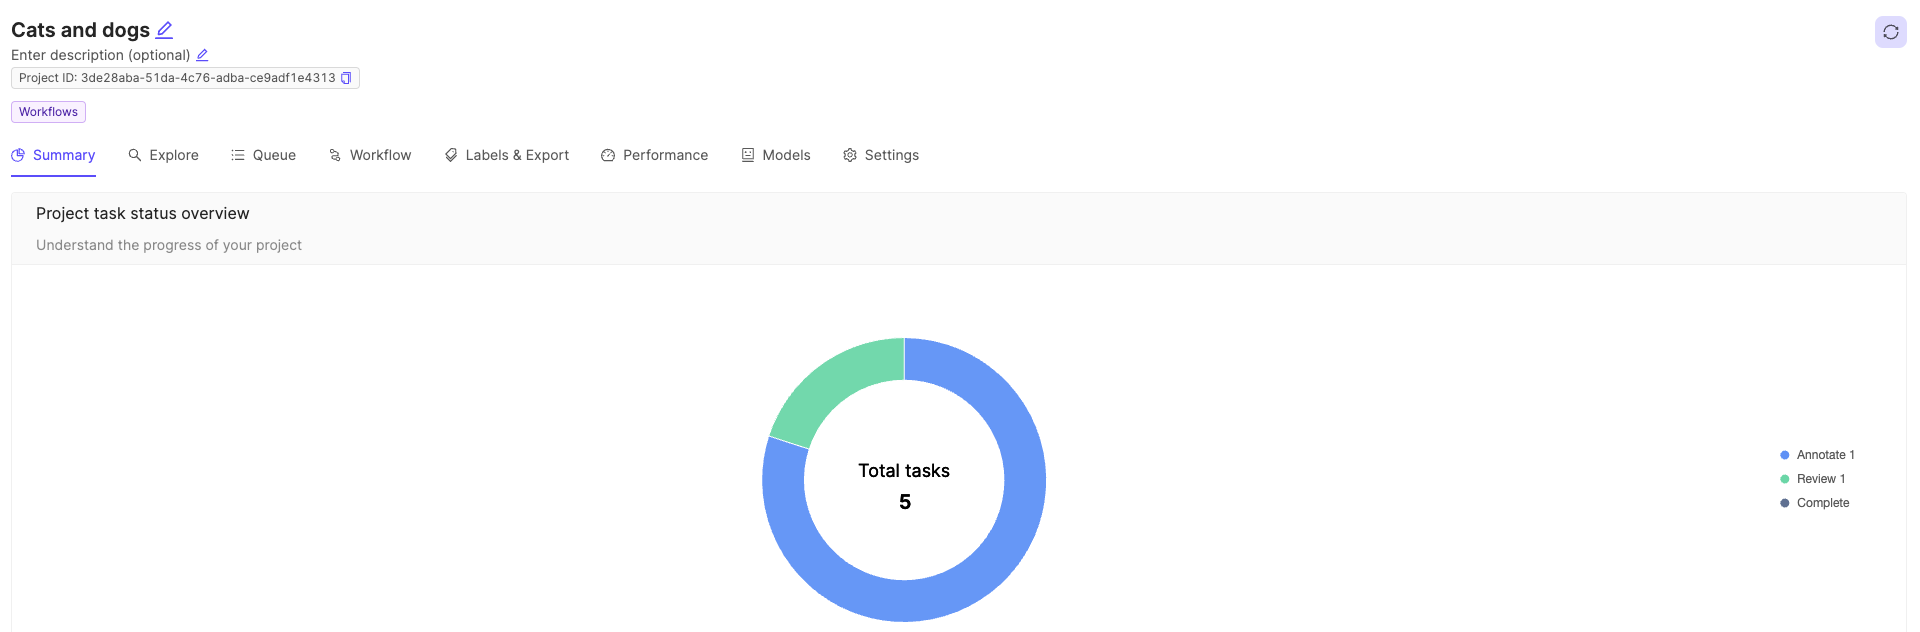
Clicking a workflow project takes you to its summary dashboard. This dashboard has 2 components and gives you a rich visual display of your project's progress at a high level.
Project task status overview
Displays the number of tasks that are in each state of your workflow project. The number of states and their names reflect the choices made during workflow project creation.
Tip
Click on the stages in the chart key to remove, or include them from the donut view
Explore
Note
The Explore tab is only visible to project Admins and Team Managers.
The Explore tab helps you understand how project annotations are distributed among data assets, at both an instance and label level. It allows a deeper exploration through attributes on objects, as well as frame-level classifications.
- Instance statistics: Class distribution across data assets in the given project.
- Label statistics: Label distributions within data assets, objects and classifications.
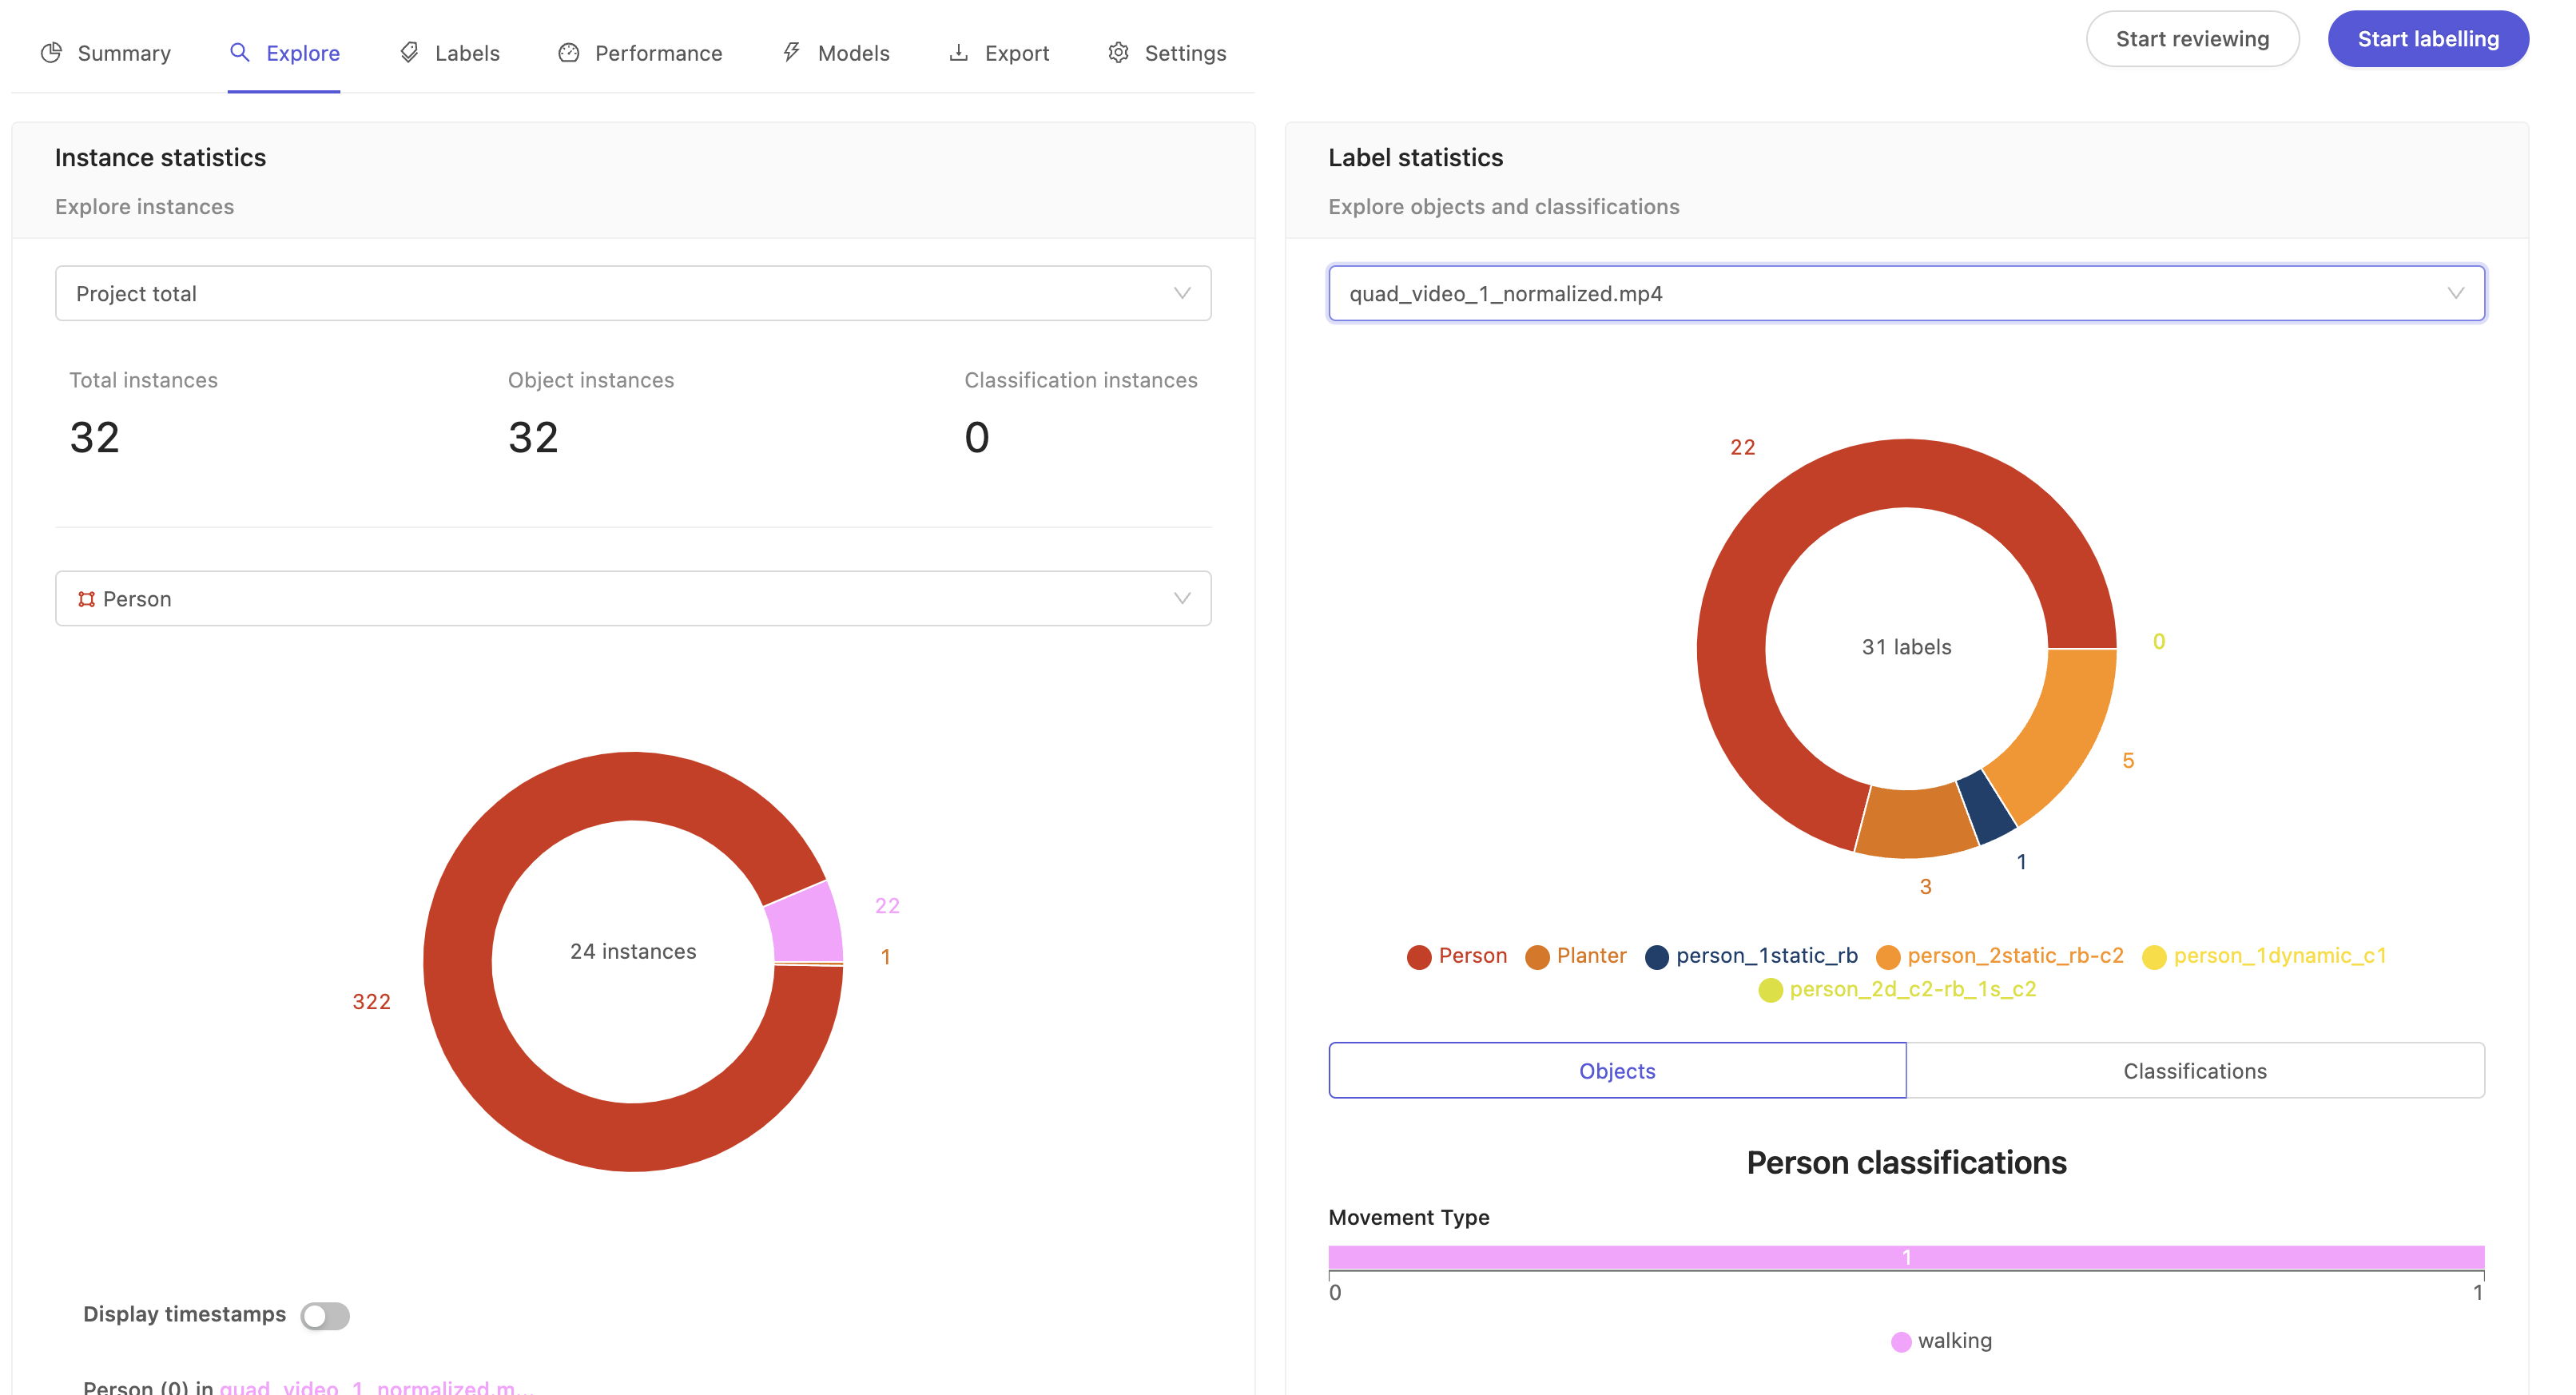
Instance statistics
This section provides the total count of all instances across the datasets in your project.
- Project total: Shows total instances (both objects and classifications) across the project by default. To get instance statistics for individual data files, click the drop-down to select a data file.
- Select class: Shows the total instances for a particular class. This is a summary of how a given class is distributed across your project's data assets. The pie chart segments show a breakdown of how that class is split across the data assets.
- Display timestamps: Flip the toggle to switch between frame numbers and timestamps for the labels.
Label statistics
This is a summary of how your labels are distributed across the project. The pie chart shows a breakdown of how many labels there are for a given class.
- Project total: Shows the total number of labels across different datasets in the project. To get label stats for individual data files, click the drop-down to select a data file.
- Objects: Click on the pie chart segment of a class to see the total number of labels and its attributes (sometimes called nested attributes) if available for that class.
- Classifications: Shows the global classification at project or individual video level. For example, location, time of day, etc.
Quick definitions of classes, instances and labels
- Class: Fundamental unit of the Project's Ontology. For example the Ontology of a Project annotating traffic
videos could have classes such as Car, Truck, Bicycle, and so on. For more information on objects and classifications, see Ontologies Overview. - Instance: Specific occurrence of a class. Car(0) is an instance of the Car class, for example, it could be a specific black sedan. The single Car(0) instance can appear in a single frame or a range of frames. Therefore, instances may contain multiple labels across frames.
- Label: An frame-specific annotation of an instance. For example the annotation of Car(0) on frame 201 is a label.
Queue
Use the Queue tab to assign and prioritize tasks and to initiate labeling and reviewing for all users attached to a Project. The Queue tab displays differently depending on the user's permissions.
Watch our tutorial video for an overview of the Queue tab!
Video Tutorial - Managing tasks (Queue tab)
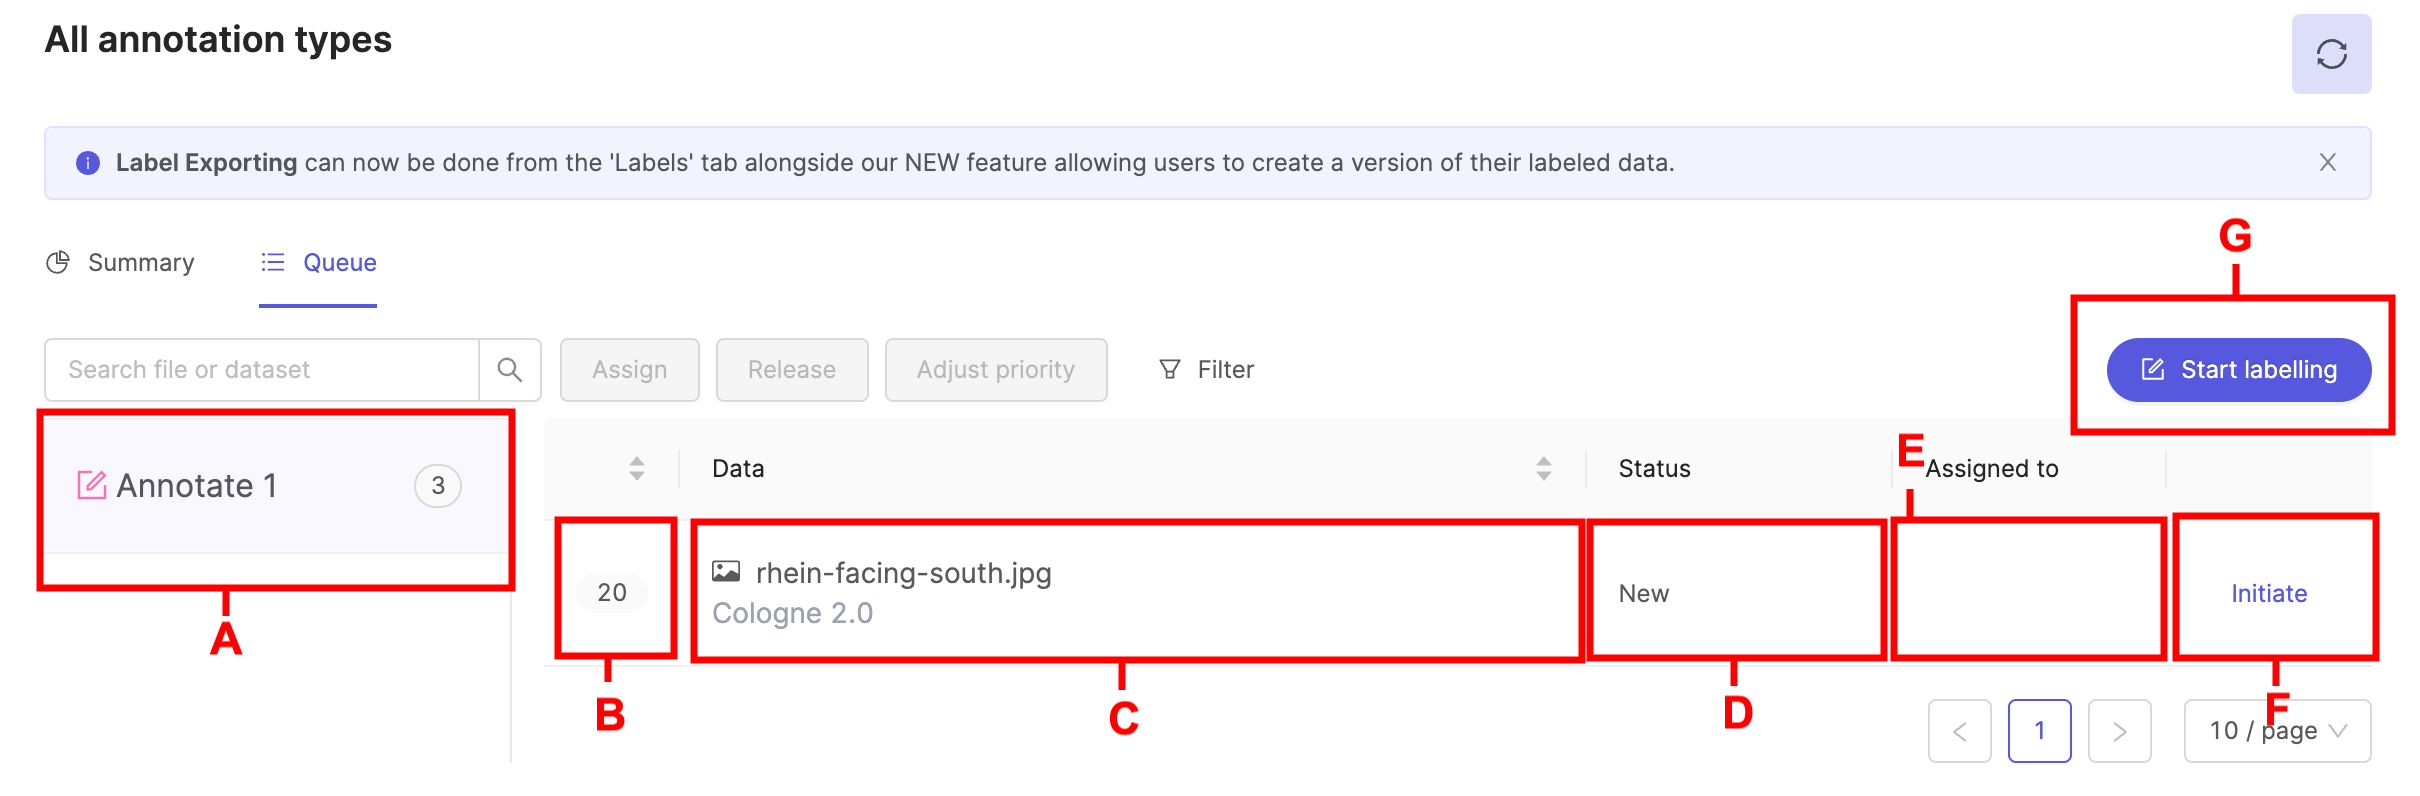
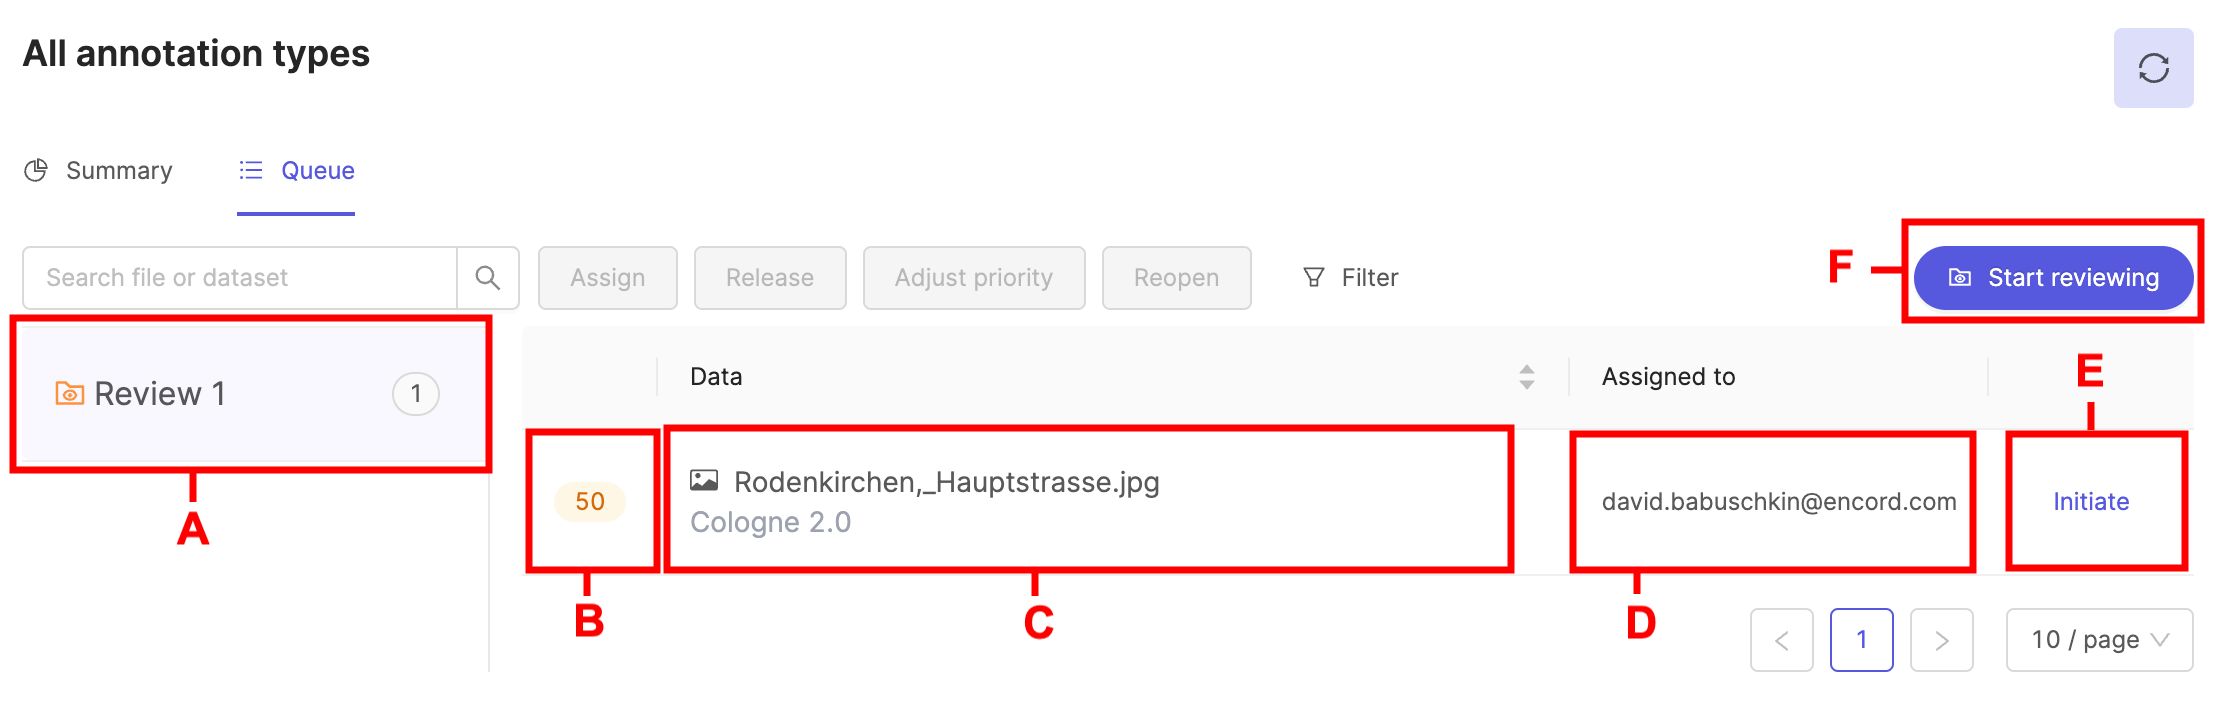
Queue (Annotator & Reviewer, Admin, Team Manager)
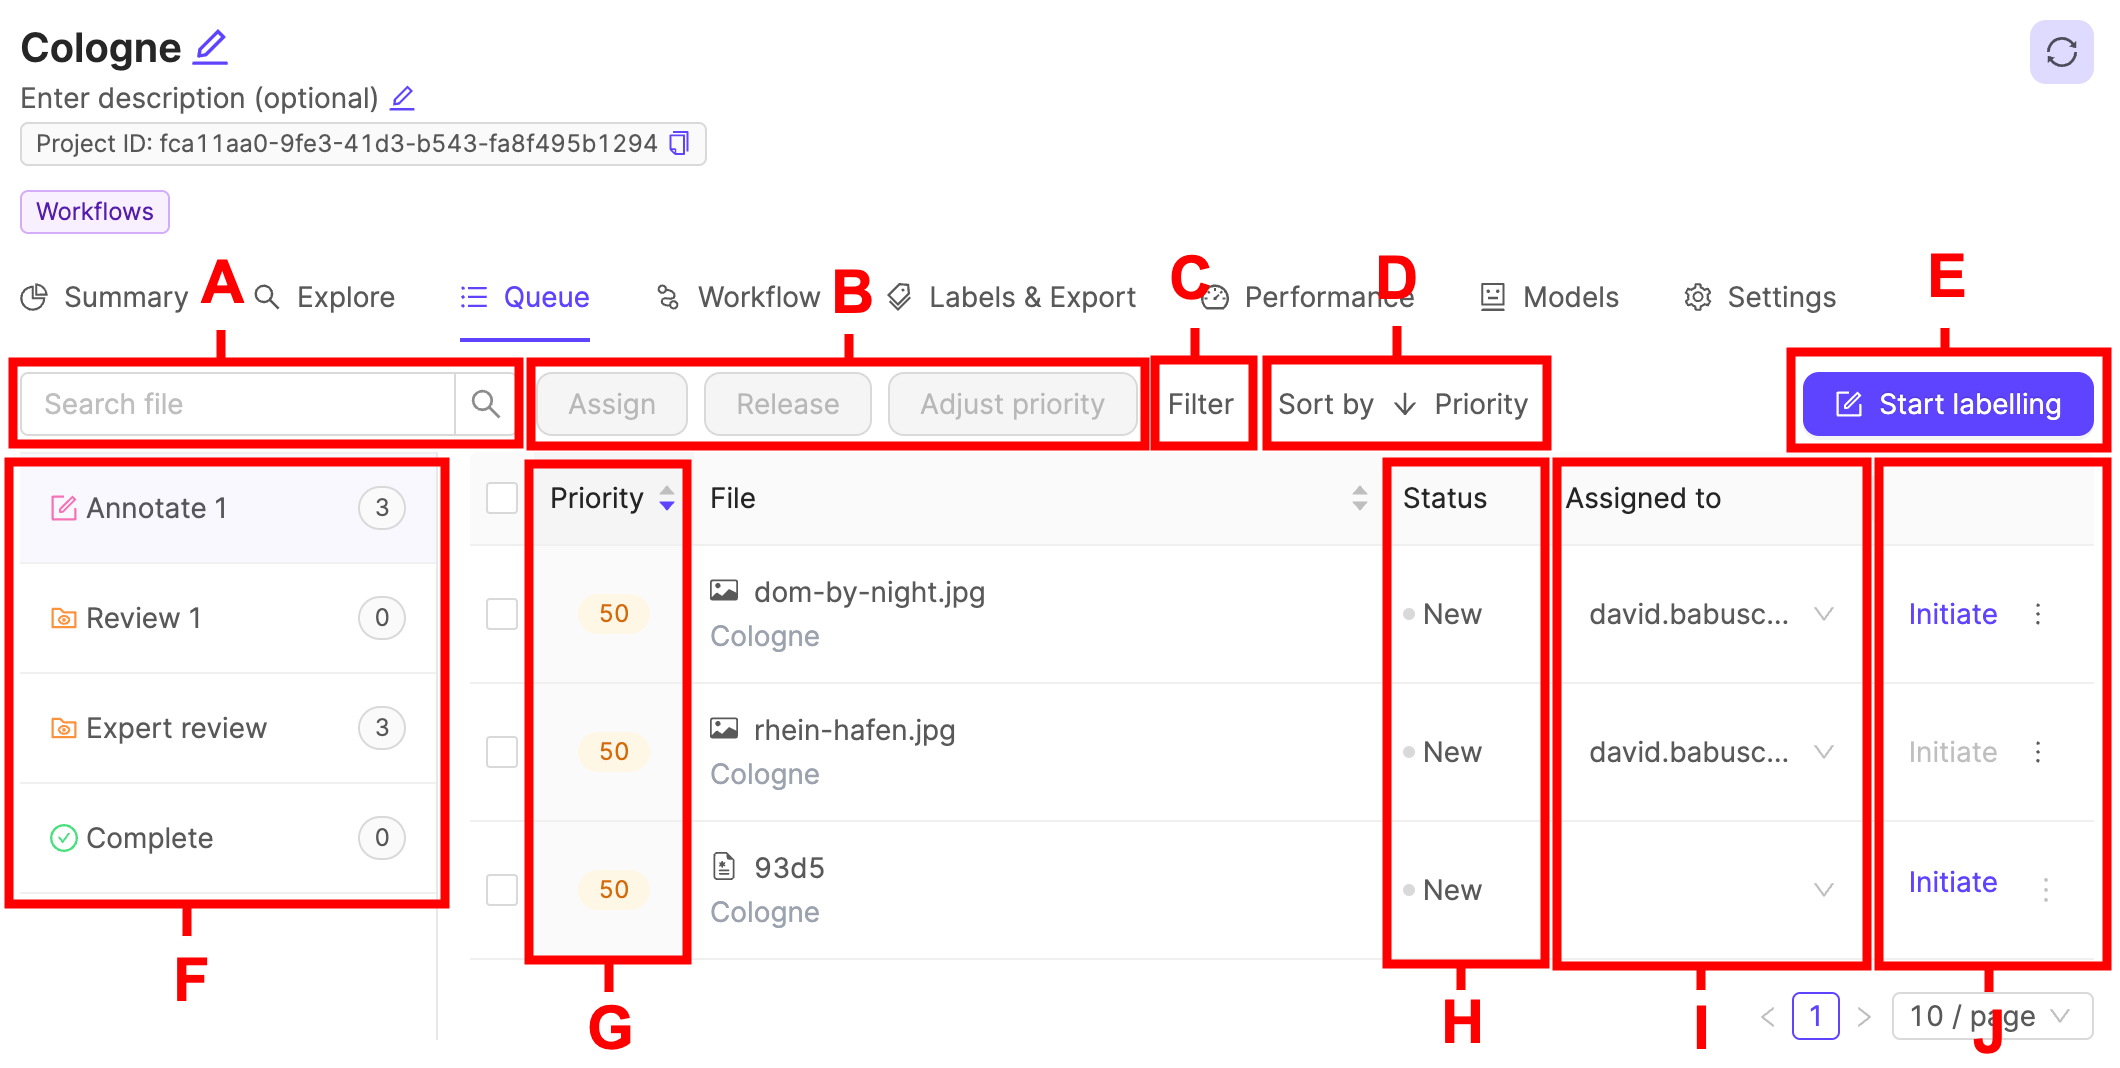
- A - Use the search bar to filter the list of data units being displayed, or to look for a particular data unit.
- B - Select a task to assign it to a user, release the task, or adjust its priority number.
- C - Filter the list of data units being displayed by task status by Dataset, User, Data Type, or Status. This is the order in which tasks will appear int he Label Editor
- D - Sort the task queue.
- E - Use the Start labeling (annotation task) and Start reviewing (review task) buttons to begin labeling or reviewing a task.
- F - The list of all Workflow stages shows how many data units each stage currently contains. Each stage can be selected.
- G - Shows the task's priority number. Tasks are listed in descending order of priority by default.
- H - Shows the task's Status.
- I - Shows the email address of the user the task is assigned to.
- J - Clicking the Initiate button initiates a task. If an annotation stage is selected, an annotation task is initiated. If a Review stage is selected a review task is initiated.
The Queue tab lists tasks in the same order they appear in the Label Editor.
Filter
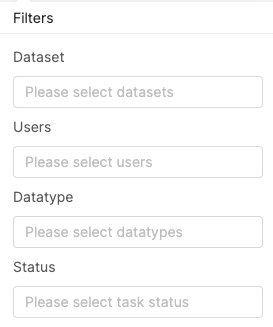
Tasks can be filtered by either Dataset, User, Data Type, or Status.
- Dataset - Filtering by Dataset will only display data units belonging to the selected Dataset(s).
- User - Filtering by User will only display tasks assigned to a particular user.
- Data Type - Filtering by Data Type will only display data units of a specific type.
- Status - Filtering by Status will only display tasks with a specific status.
Sort by
You can sort the task queue by clicking Sort by next to the filter button. Select whether you want to sort the task queue by:
- Task priority, or alphabetically by the name of the data unit.
- In ascending or descending order.
The default sorting is in descending order of task priority.
Status
The task Status indicates which actions had previously been taken on a task.
- New - The task has not been worked on since being added to the Project.
- Reopened - The task was rejected during the Review stage, and has been returned for re-labeling.
- Skipped - The task was skipped by one or more annotators.
Assigning and releasing tasks
Note
Only Admins and Task Managers can assign and release tasks.
Note
Tasks can only be assigned to collaborators that have been added to a given Workflow stage. Find out more in our section on managing collaborators.
Tasks can be assigned to specific users by selecting them from the list and clicking the Assign button, as shown below. Once a task is assigned, only the assigned user is able to open the task. Alternatively, click the ![]() button in the Assigned to column to assign an individual data unit.
button in the Assigned to column to assign an individual data unit.
Releasing a task is the opposite of assigning a task, and removes any user the task was assigned to. To release any number of tasks, select them from the list and click the Release button located next to the Assign button shown above.
Tip
Unassigned tasks can be initiated by all users.
Task priority
Note
Only Admins and Task Managers can set task priority.
All annotation and review tasks can be assigned a priority level to manage workflow efficiency. Each task is assigned a priority value ranging from 0 to 100, where the default value is set to 50. A value of 100 indicates a high-priority task, requiring immediate attention, where a value of 0 signifies a low-priority task. Annotation and review tasks with higher priority levels are displayed in the label editor in descending order of priority.
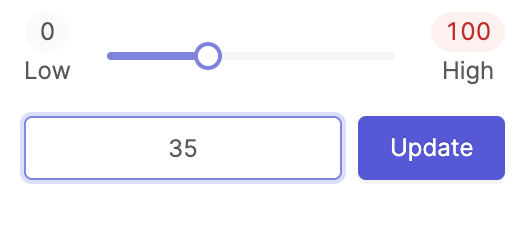
To update task priority:
-
Click on the number representing the task's current priority. This action opens the priority setting interface for that particular task. Alternativly, select the task and click the Adjust priority button.
-
Adjust the task's priority by either using the slider for quick selection or manually entering a specific number between 0 and 100 in the input field provided. This allows for precise control over the task's priority level.
-
Once the desired priority level is set, finalize your changes by clicking the Update button. This action saves the new priority setting for the task, effectively updating its status in the task queue.
Queue (Annotators)
Annotators are presented with the following Queue tab, from which they can manage their annotations.
- A - The list of annotation stages shows how many data units each stage currently contains. If more than one stage is listed, clicking a stage lets you view the tasks it contains.
- B - Shows the task's priority number. Tasks are listed in descending order of priority by default.
- C - The list of tasks / data units in your queue. Unassigned tasks are also visible and they can be initiated by all Annotators.
- D - The task status.
- E - The user a task is assigned to. A blank field indicates an unassigned task.
- F - Click the Initiate button next to a task to start annotating.
- G - The Start labeling button opens the Label Editor, starting with the highest priority task.
The Queue tab lists tasks in the same order they appear in the Label Editor.
Note
Initiating an unassigned task automatically assigns the task to the Annotator.
Queue (Reviewers)
- A - The list of review stages shows how many data units each stage currently contains. If more than one stage is listed, clicking a stage lets you view the tasks it contains.
- B - Shows the task's priority number. Tasks are listed in descending order of priority by default.
- C - The list of tasks / data units in your queue. Unassigned tasks are also visible and they can be initiated by all Reviewers.
- D - The task status.
- E - The user a task is assigned to. A blank field indicates an unassigned task.
- F - Click the Initiate button next to a task to review it .
- G - The Start reviewing button opens the Label Editor, starting with the highest priority task.
The Queue tab lists tasks in the same order they appear in the Label Editor.
Note
Initiating an unassigned task automatically assigns the task to the Reviewer.
Labels
Note
The Labels tab is only visible to project Admins and Team Managers.
The Labels tab is your gateway to auditing and exporting labels created in your project.
Access to each pane will depend on the user's project role. We quickly summarize the purpose of each tab, and the roles which can access each below.
| Role | Activity | Queue | Data | Instances |
|---|---|---|---|---|
| Annotator | ❌ | ✅ | ❌ | ❌ |
| Reviewer | ❌ | ✅ | ❌ | ❌ |
| Annotator + Reviewer | ❌ | ✅ | ❌ | ❌ |
| Team Manager | ✅ | ✅ | ✅ | ✅ |
| Admin | ✅ | ✅ | ✅ | ✅ |
The labels dashboard features the following tabs:
- Data: A complete overview of all tasks in the project, with the option to export your labels on a per-task basis.
- Label Instances: The Label Instances tab lets you use the unique instance identifier to search the project for a specific instance, and jump directly into the editor to confirm the status of an annotation visually.
Data
The Data tab provides a complete overview of all tasks in the project, and lets you see which workflow stage each task is in.
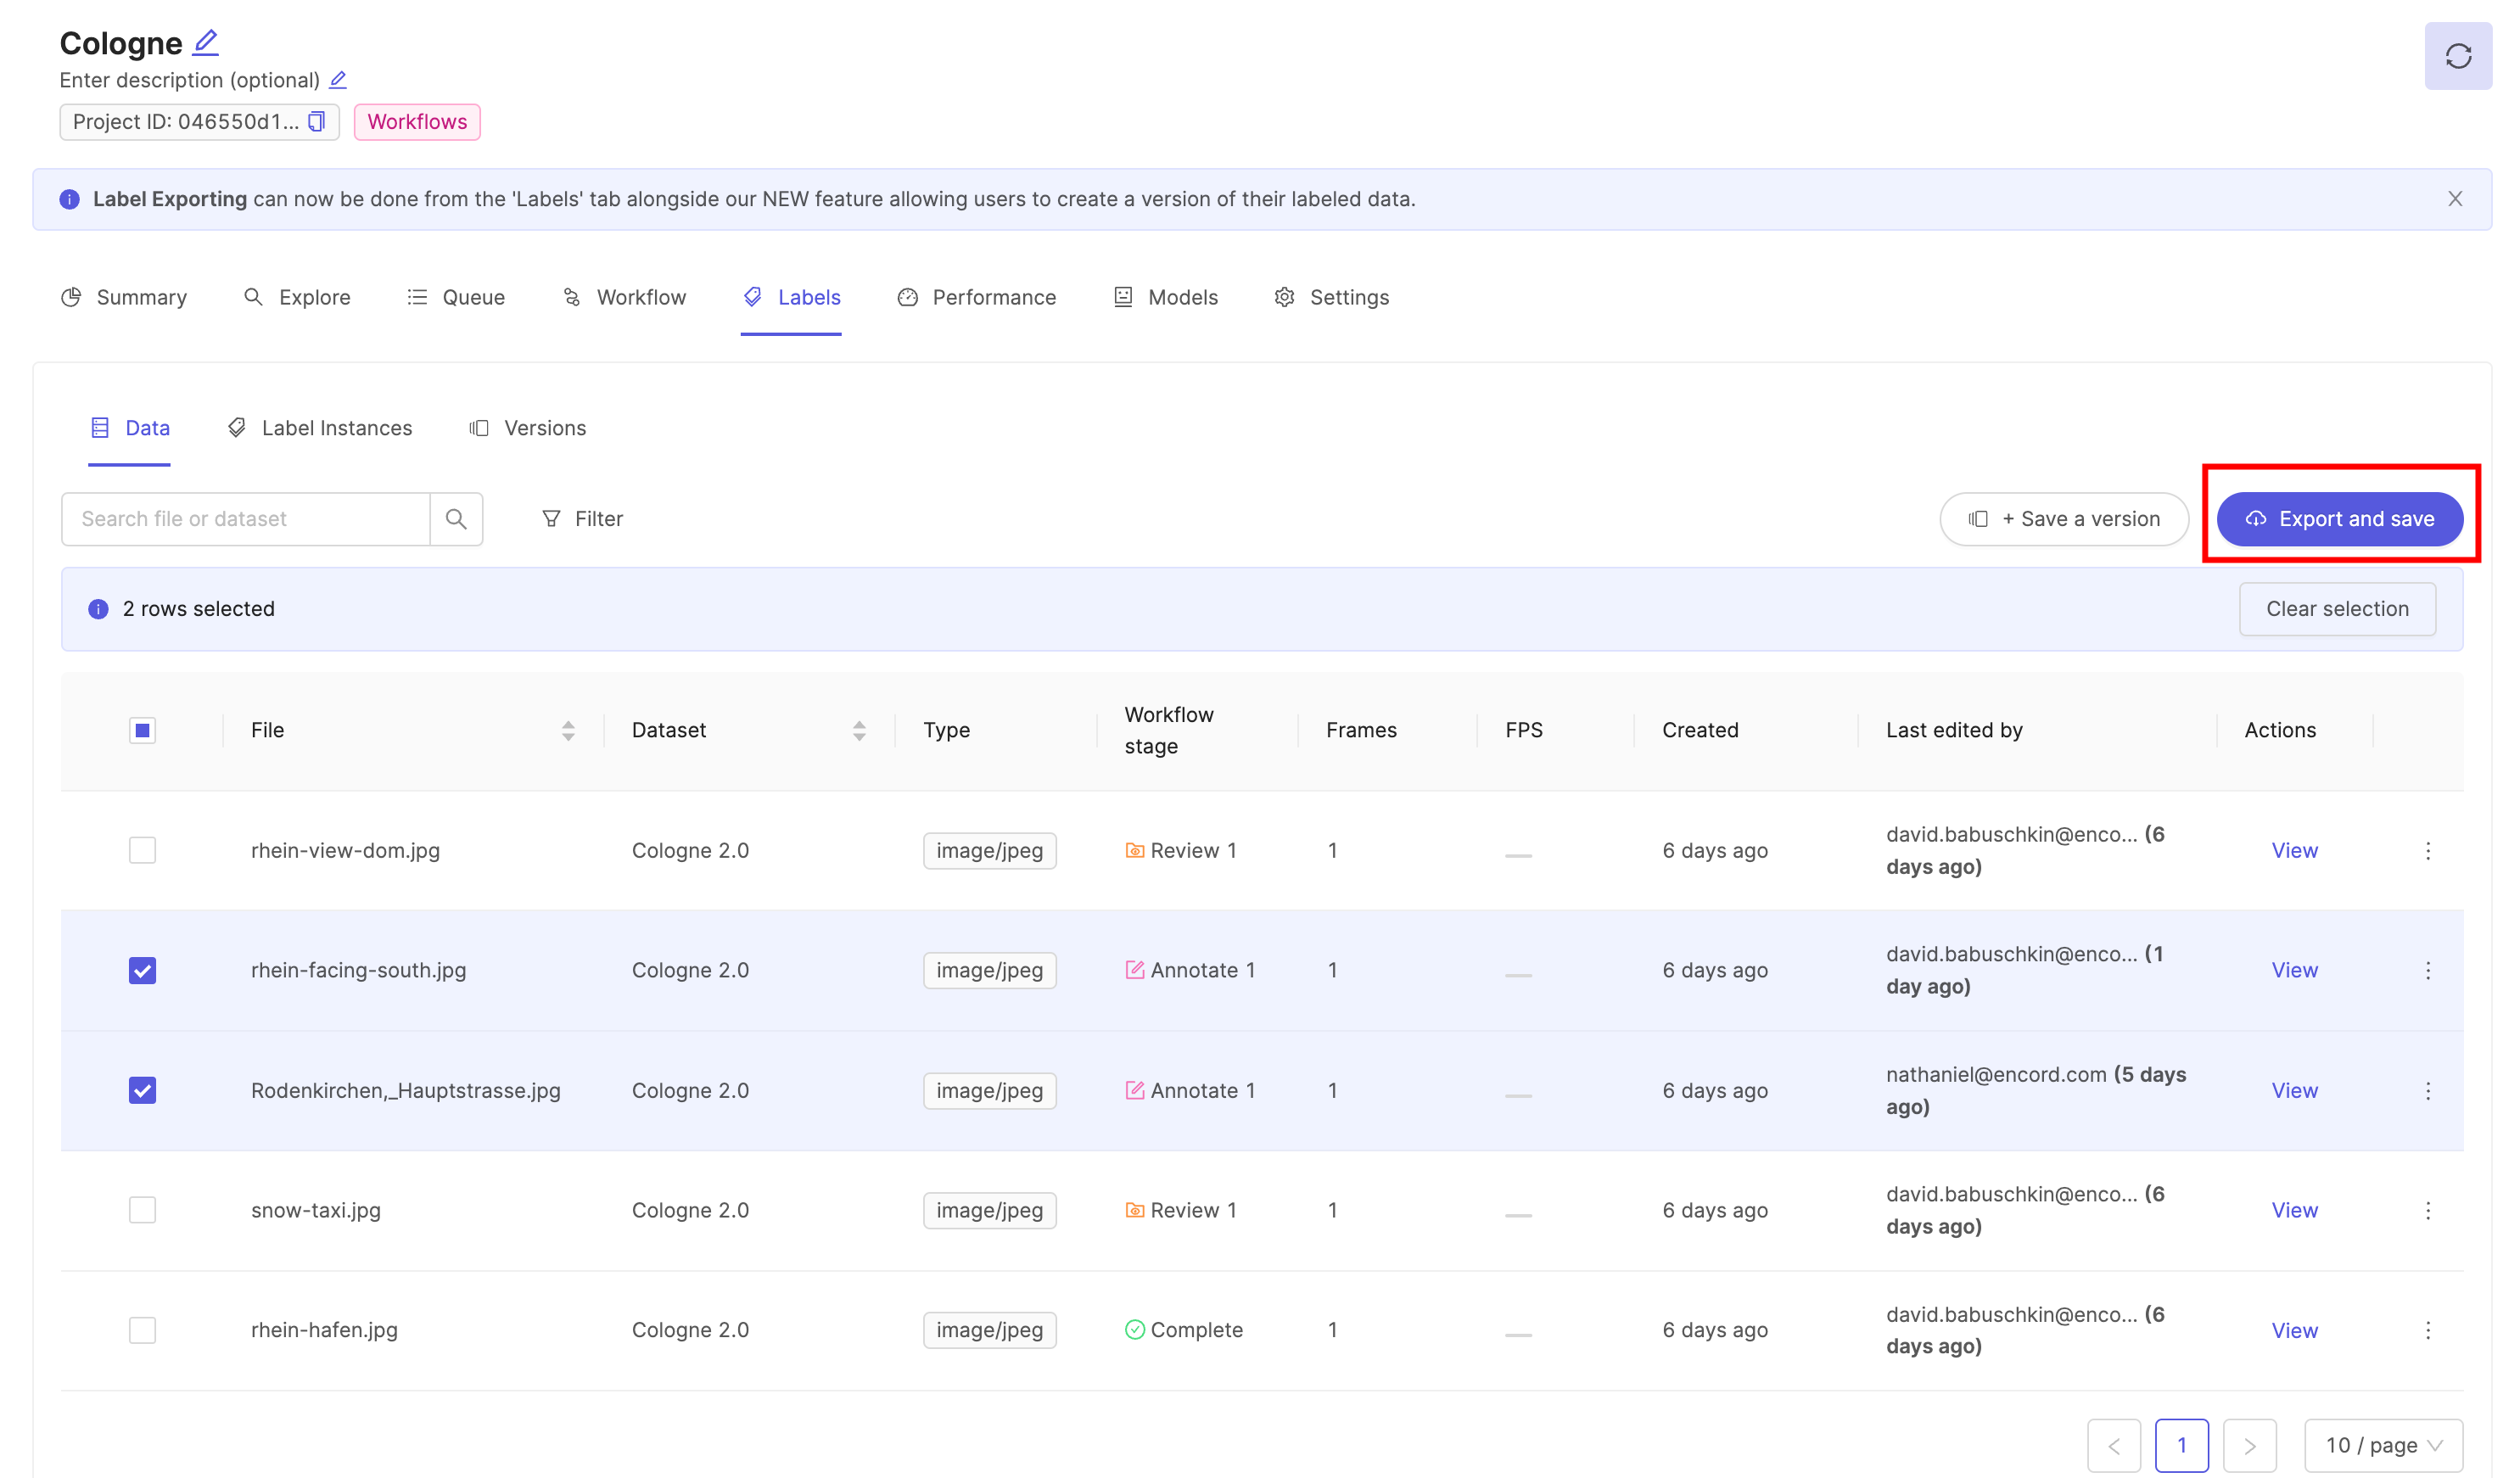
Export labels
Select the data units you want to export labels for and click the Export and save button highlighted in the screenshot below to export labels. See our documentation on exporting labels for more information.
Save label version
Select the data units you'd like to save label version for and click the Save new version button highlighted in the screenshot below. It will be listed in the Saved versions tab.
Note
A new label version is saved each time you export labels.
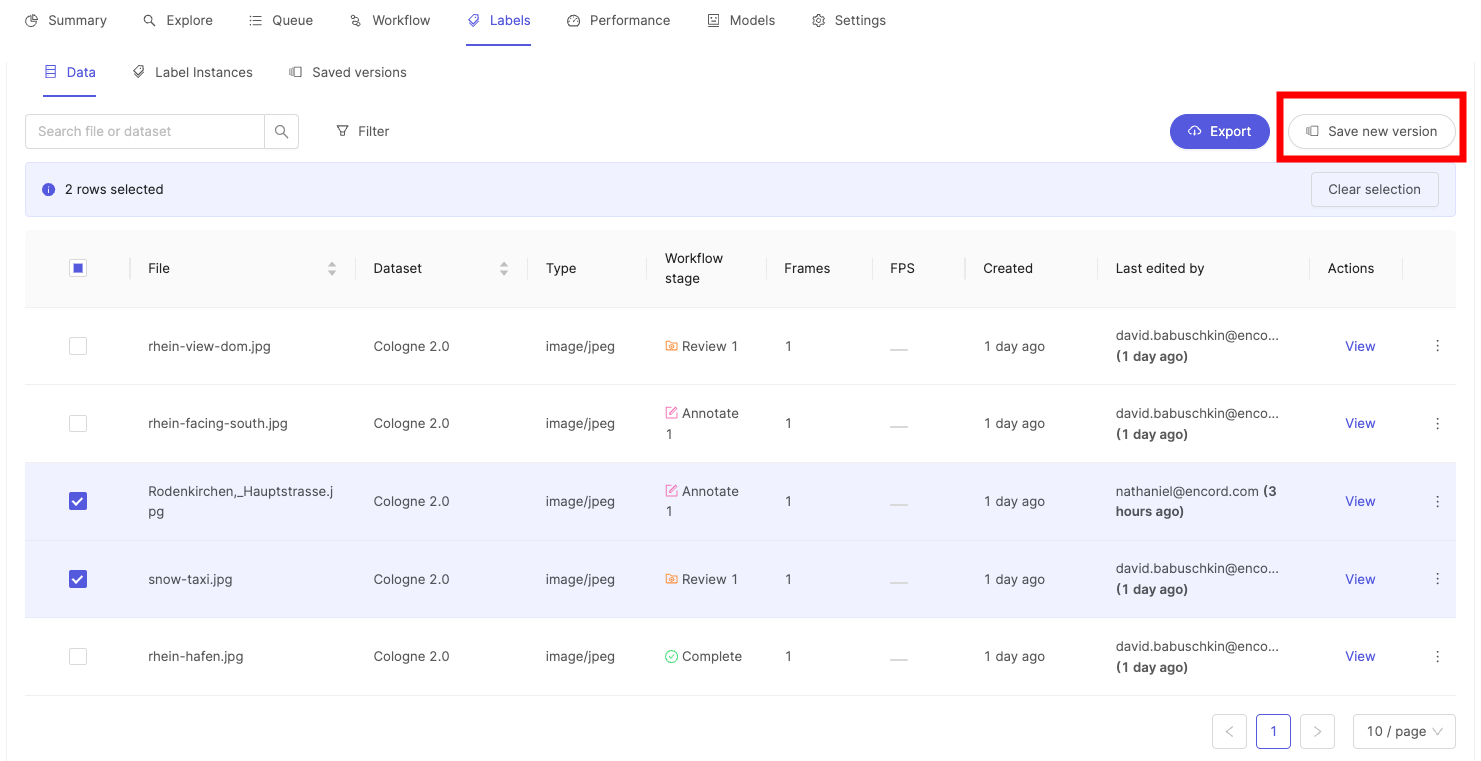
Label versioning allows you to keep track of your label history over time by providing a snapshot of labels at a point in time. Label versions can be exported and analyzed to track annotation performance over time.
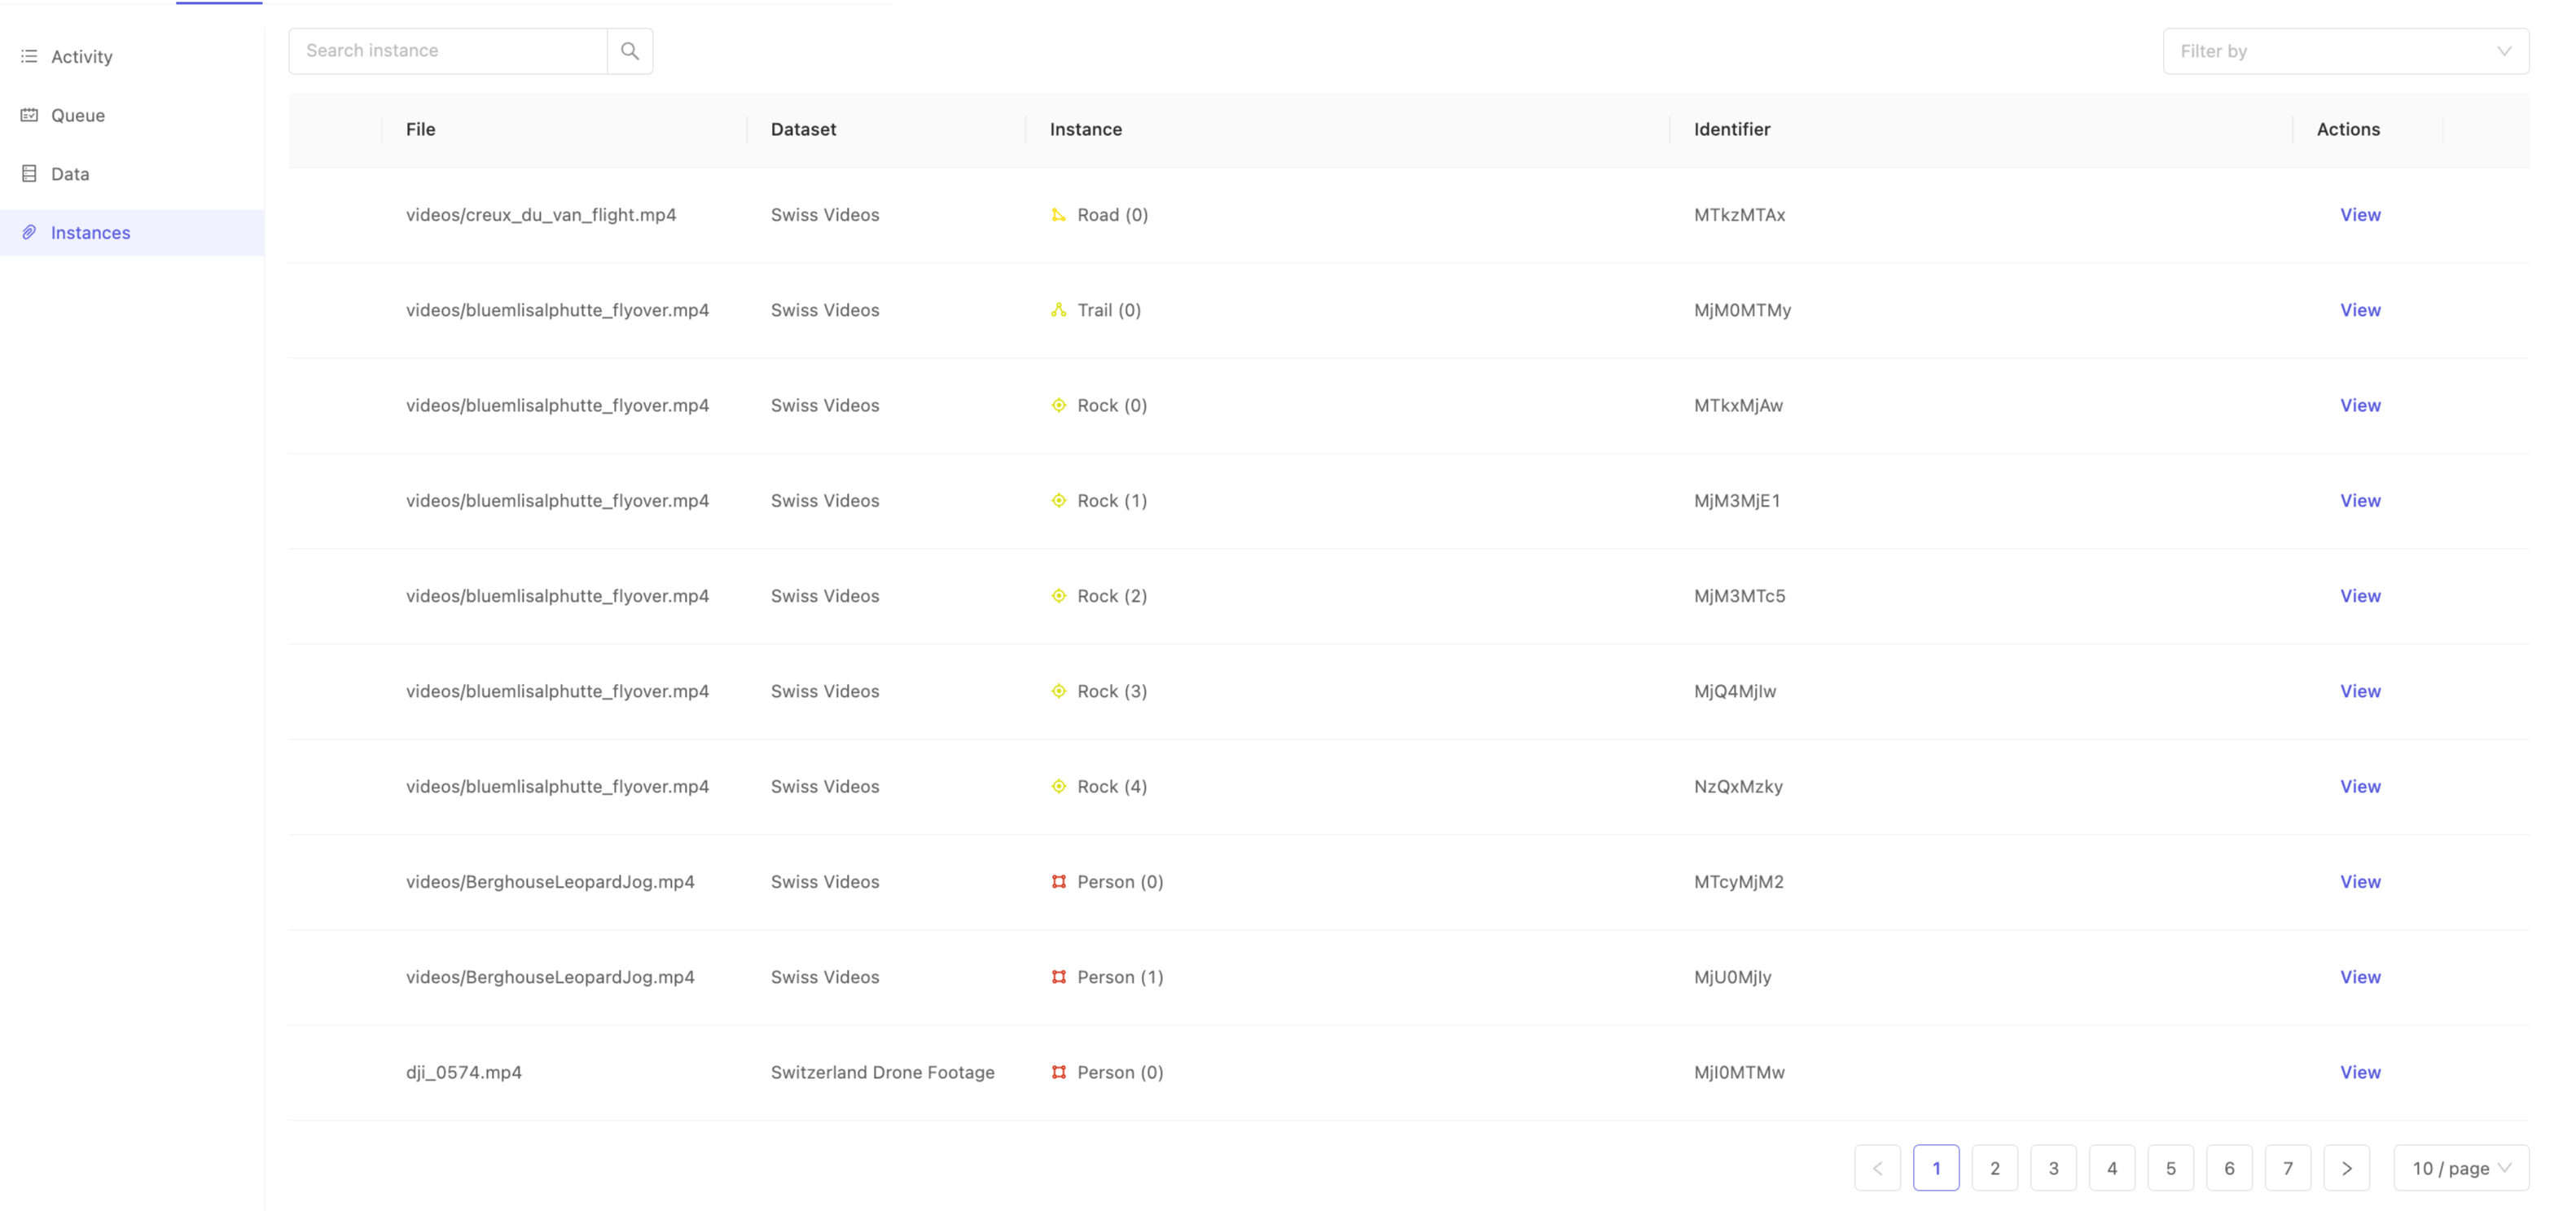
Label Instances
The Instances tab allows Administrators and Team Managers to search within the data to directly find specific instances Recall that an annotation instance correlates to a unique instantiation of a specific ontology class in a data asset. For example, if you have the 'Person' class in your ontology, the first instance of a 'Person' in a given data asset will be indicated in the interface as 'Person (0)', the second as 'Person (1)' and so on. Instances, therefore, can exist in multiple frames of a data asset, and indicate the same object. Use the Instances tab to search for specific instances of objects or classifications using their Identifier.
Instance identifiers are unique at the project scope, and can be found in any of the following ways:
- From inside the label editor, by clicking on a particular instance, and then selecting 'Copy identifier' from the instance action menu.
- From inside exported labels, where they are known as the
objectHashorclassificationHashas appropriate. - When uploading labels using the SDK, you may specify your own
objectHashorclassificationHash.
Once you have an identifier of interest, use the 'Search instance' interface to filter the instances by identifier to quickly find the instance you're interested in. This can be particularly handy when you want to visually confirm an annotation you may not have seen before, but for which you have the identifier.
After locating your instance of interest, click View from the 'Actions' column to jump deeply into the dataset straight to where the instance is first annotated.
Saved versions
The Saved versions tab displays information for versions of your labels. The Actions column lets you:
-
Export label versions by clicking the
 icon in the Actions column. For format of exported labels has the same structure as outlined in the export documentation.
 -
Delete label versions by clicking the
 icon in the Actions column.
Performance - Summary
Note
The Performance dashboard is only visible to project Admins and Team Managers.
The Summary tab of the performance dashboard provides an overview of your team's labeling and productivity. You're able to switch between a summary, or detailed view of performance metrics using the toggle found at the top of the Performance tab.
Caution
The Summary tab only displays actions taken in the Label Editor. Actions taken in the SDK will not be displayed.
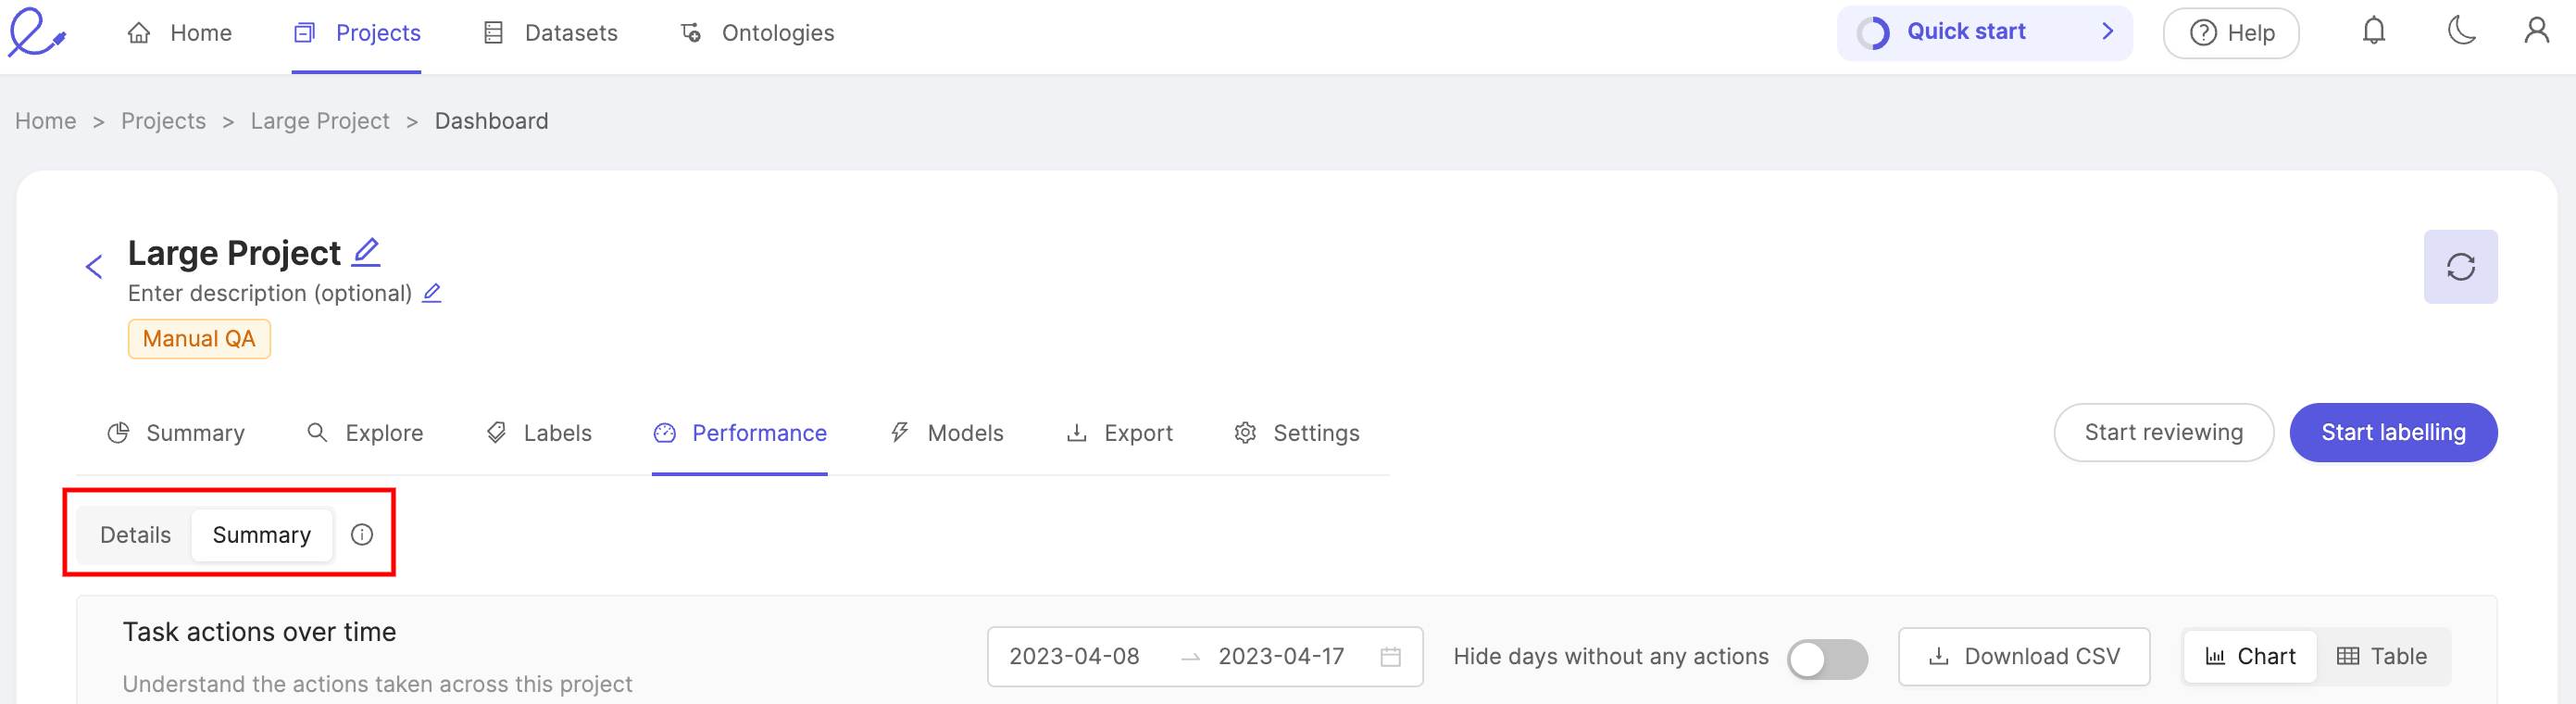
Task actions over time
View the number of tasks in a project that have been approved, rejected, and submitted for review over a given period of time.
- The height of a bar represents the total number of tasks.
- The height of each color within a bar represents the number of approved, rejected, and submitted tasks.
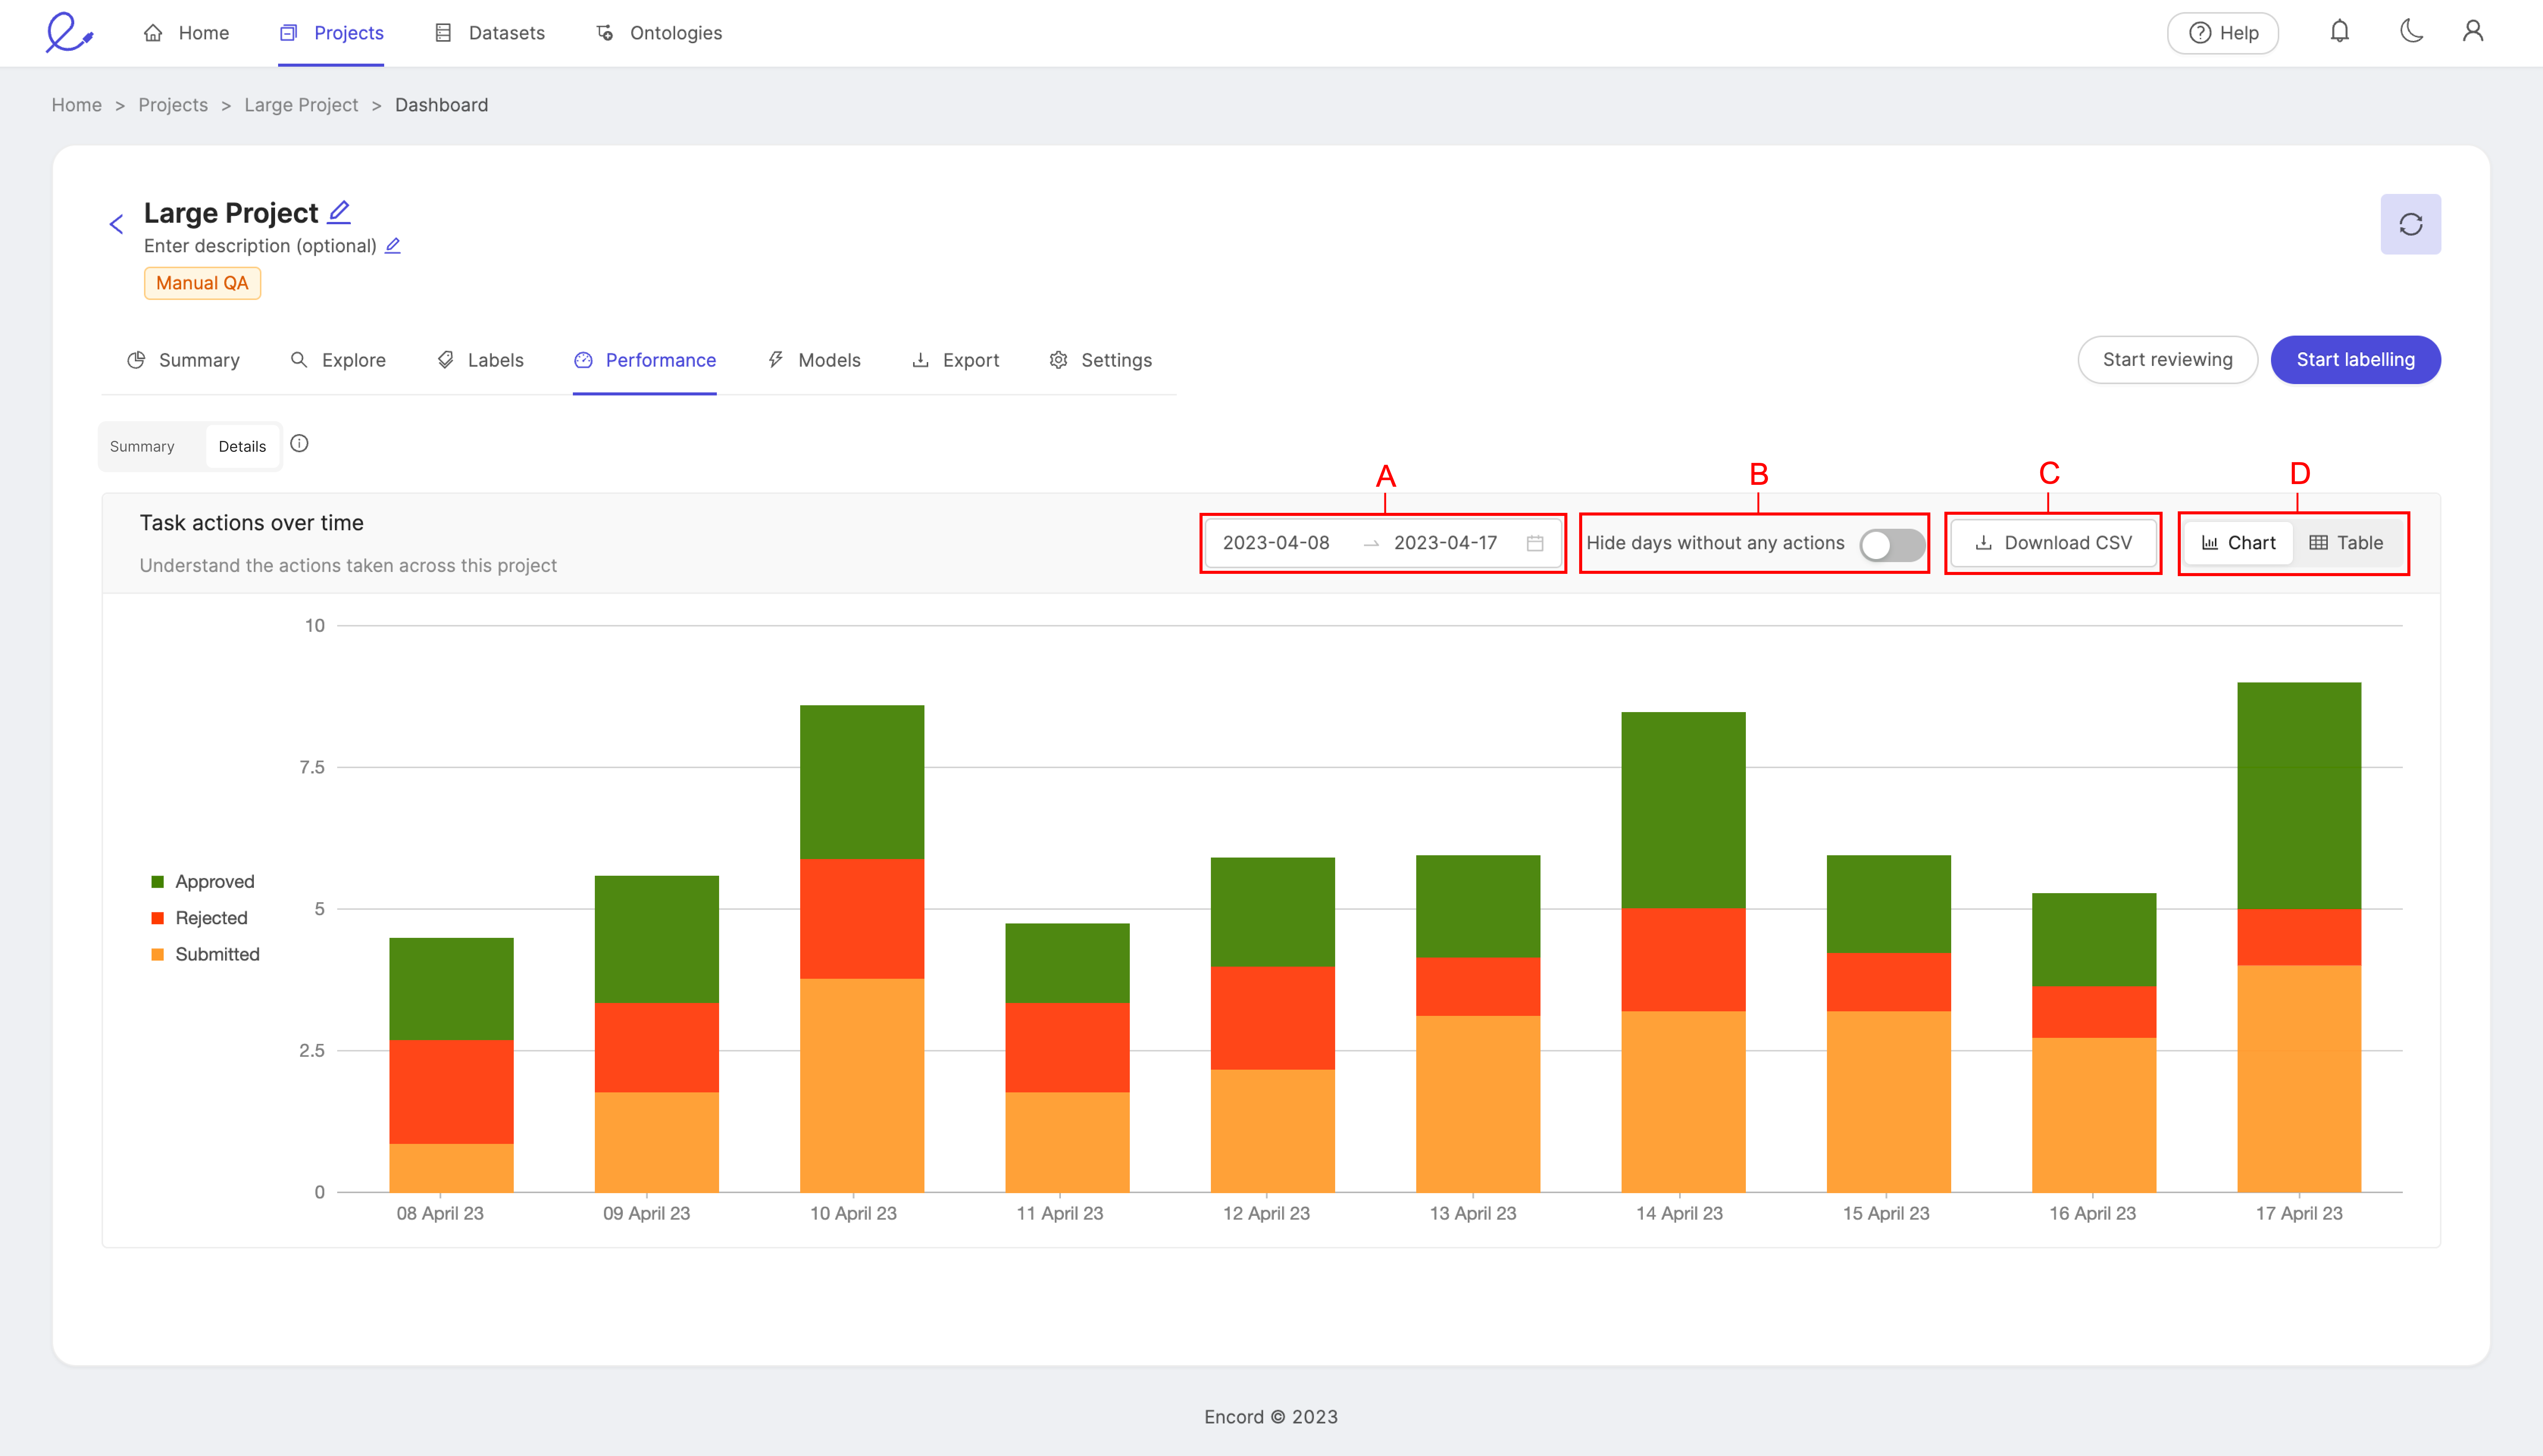
- A: Set the time period you would like to see displayed by selecting a range of dates.
- B: The Hide days without any actions toggle removes all days at which no actions were taken from the view.
- C: Download a CSV file of the data.
- D: Display the data as a bar chart, or a table. While the chart provides a clear visual representation, the table provides exact figures for a more detailed picture of your team's performance.
Instance Label actions over time
View the number of instance label actions in a project that have been approved, rejected, and submitted for review over a given period of time.
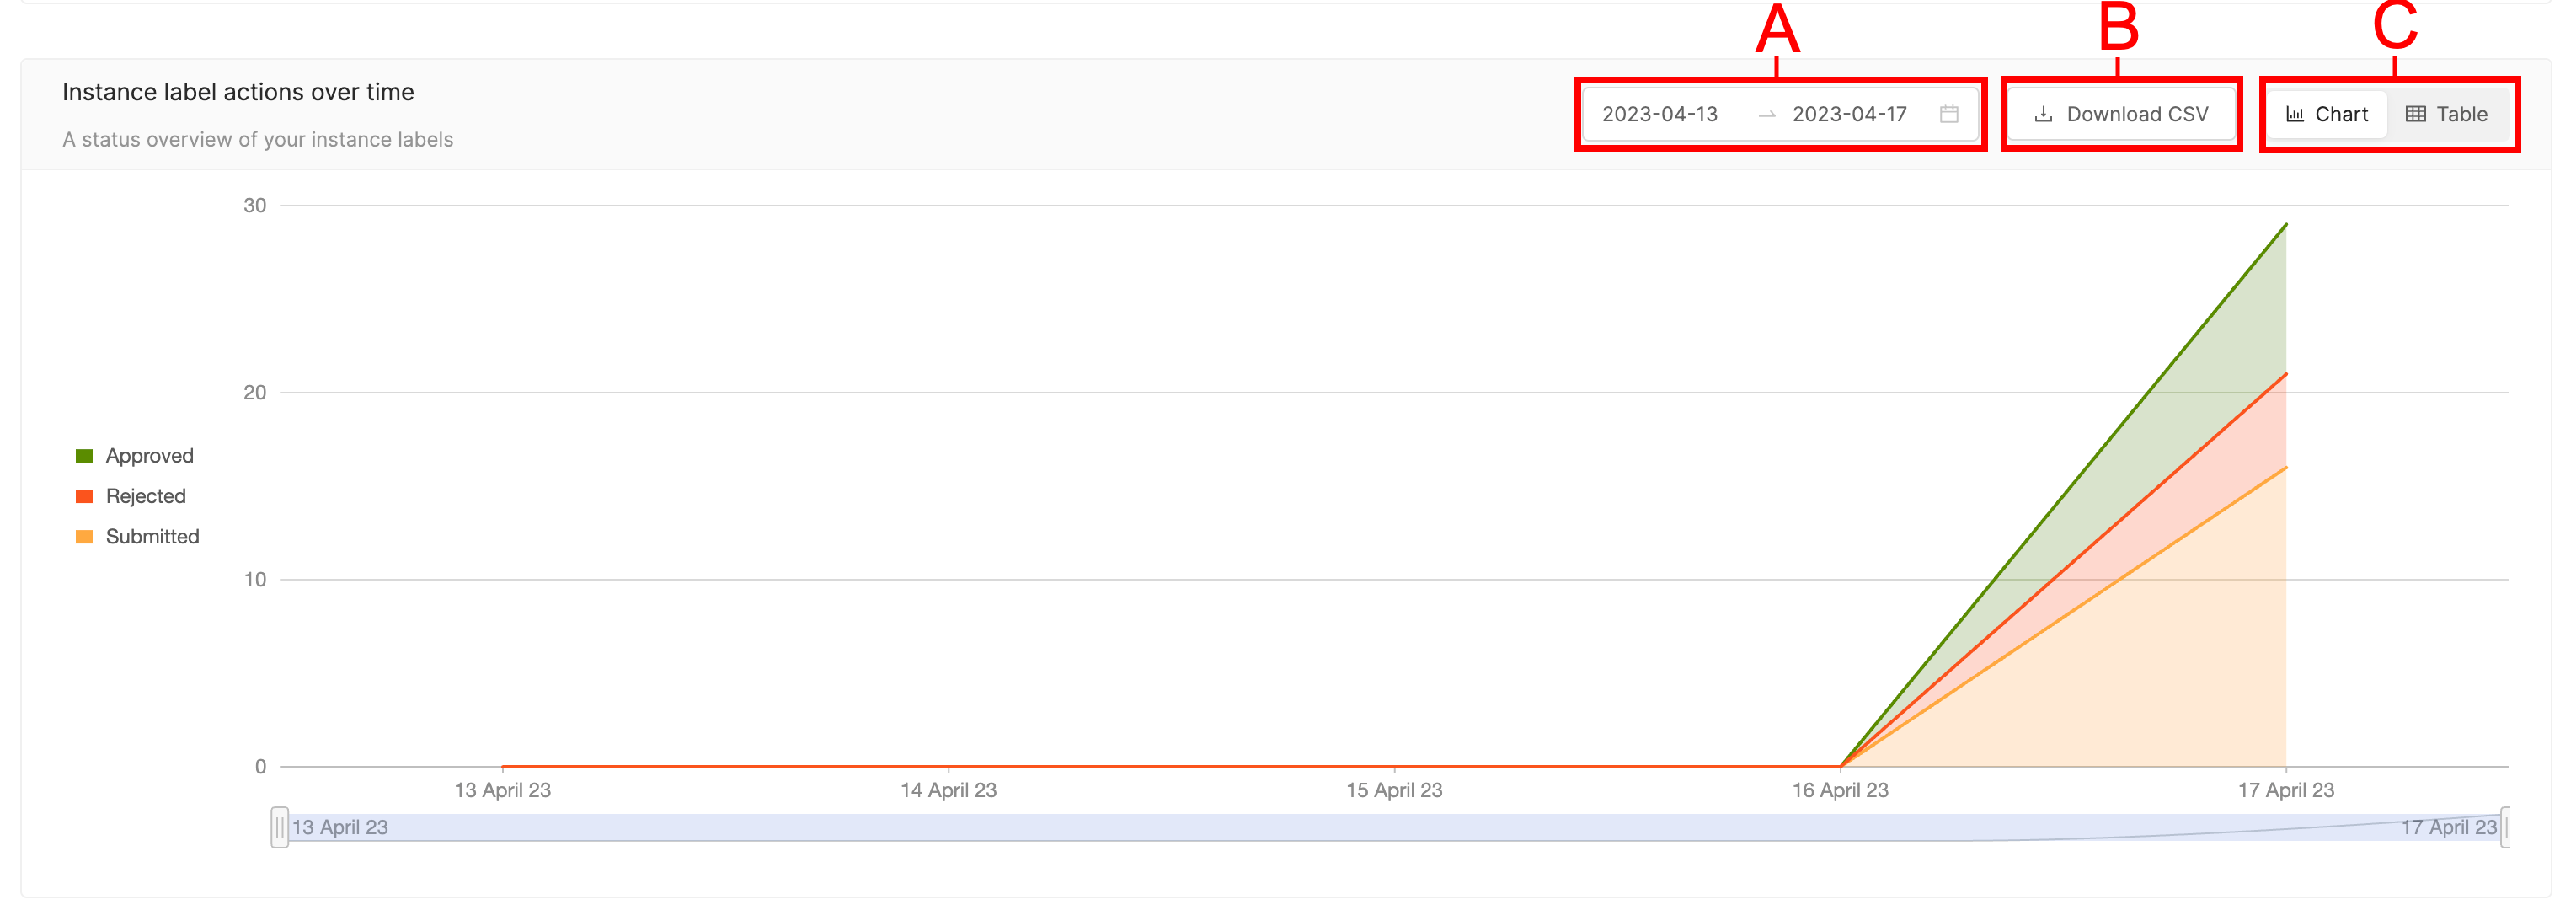
- A: Set the time period you would like to see displayed by selecting a range of dates.
- B: Download a CSV file of the data.
- C: Display the data as a bar chart, or a table. While the chart provides a clear visual representation, the table provides exact figures for a more detailed picture of your team's performance.
Within your specified time period, you can choose which dates to display by using the slider located beneath the graph.
Team collaborators
The 'Team collaborators' section the duration of time each project collaborator spend working on a given file.
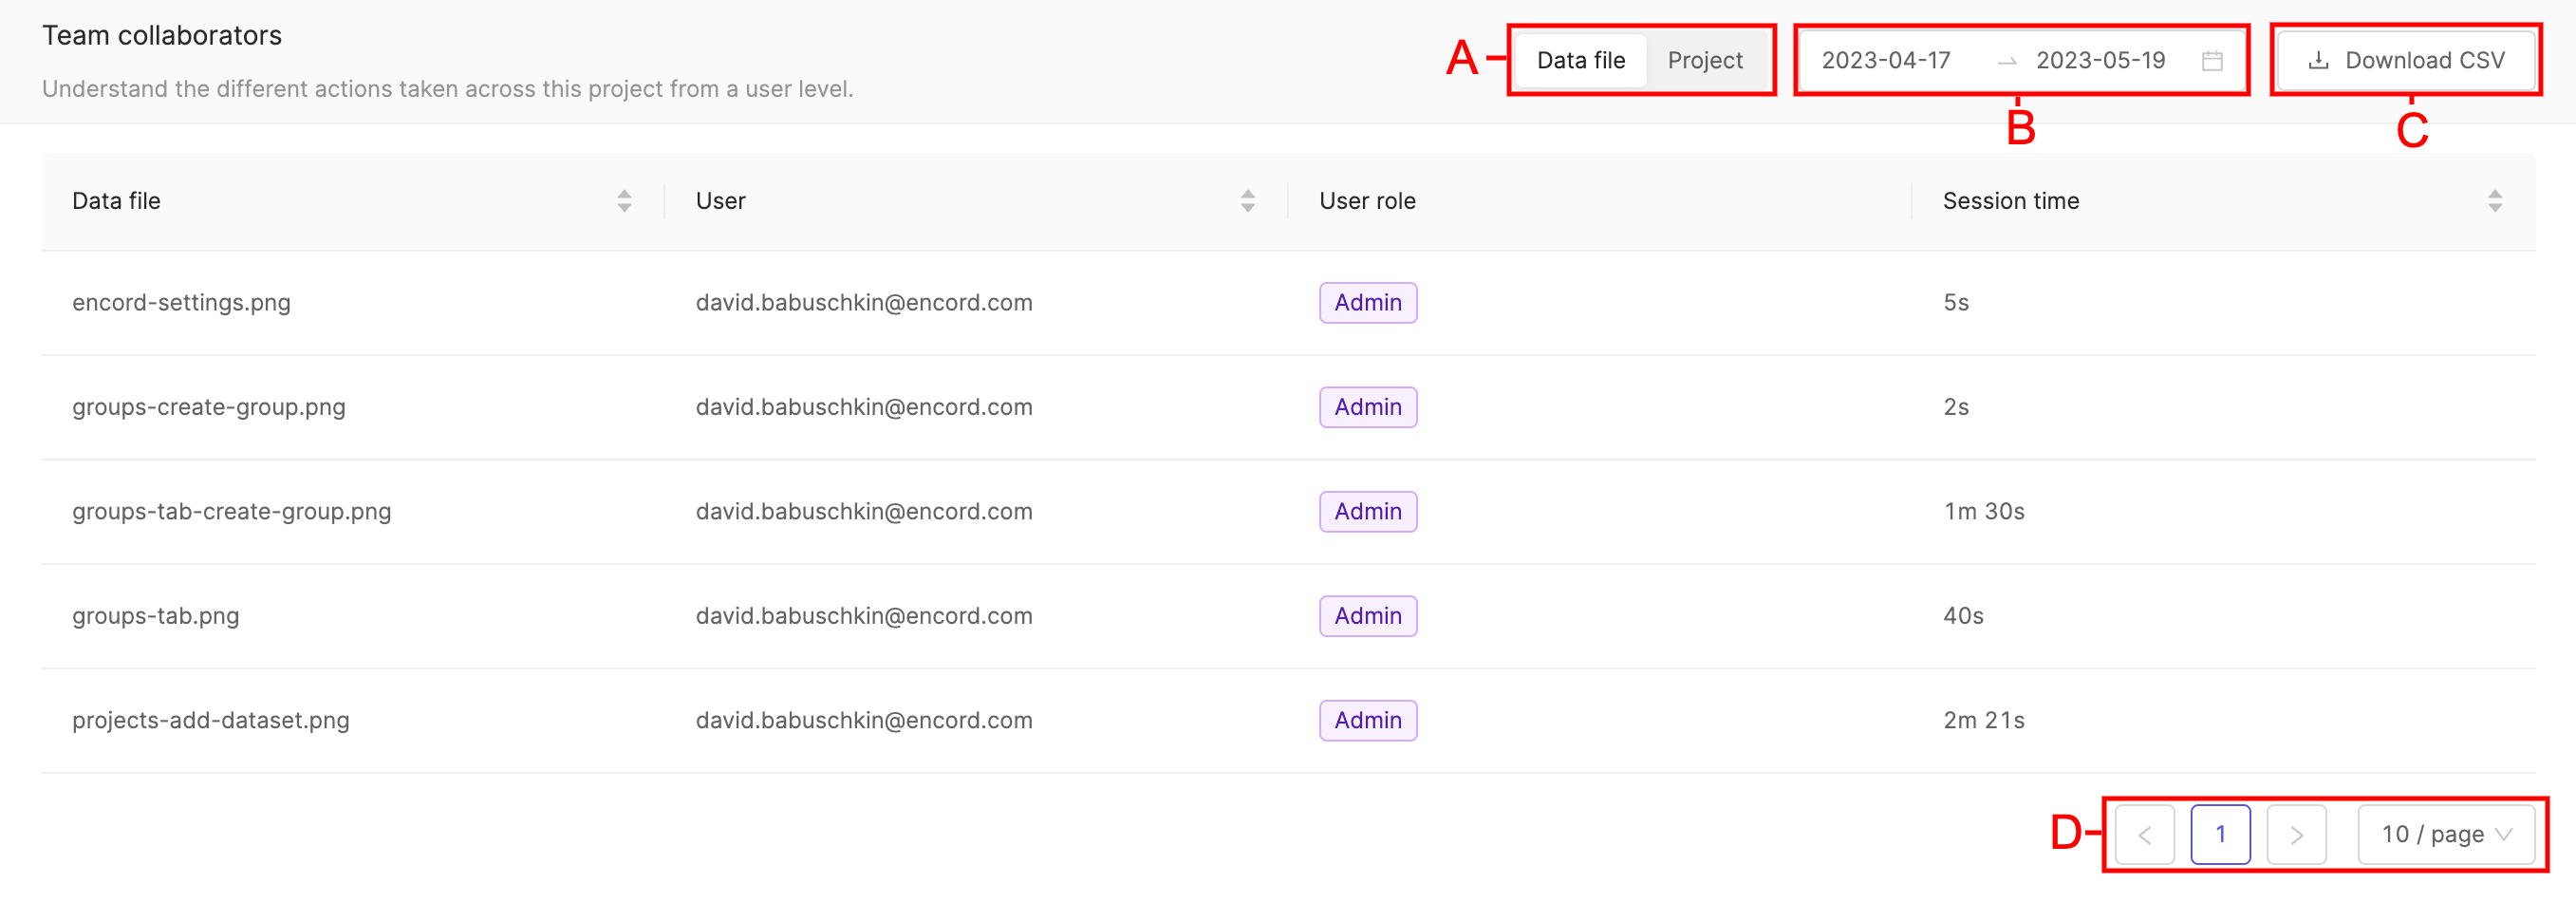
A. Table entries can be filtered according to dates by clicking the range of dates, and selecting the start and end date of the period you would like to see table entries displayed for.
B. Table entries can be downloaded in CSV format by clicking the Download CSV button.
C. When lots of entries are present they will be split across a number of different pages. The number of table entries per table can be adjusted.
Performance - Details
The Details tab of the performance dashboard gives a more detailed view of your team's manual labeling and productivity.
Caution
The Details tab of the performance dashboard only shows information for labels created in the Label Editor. Labels submitted via the SDK will not be shown on the Details tab. This includes labels that were submitted using the SDK, and edited in the Label Editor.
Tip
You can specify a range of dates, as well as whether statistics should be displayed for labels, or instances. More information on instances and labels can be found here.
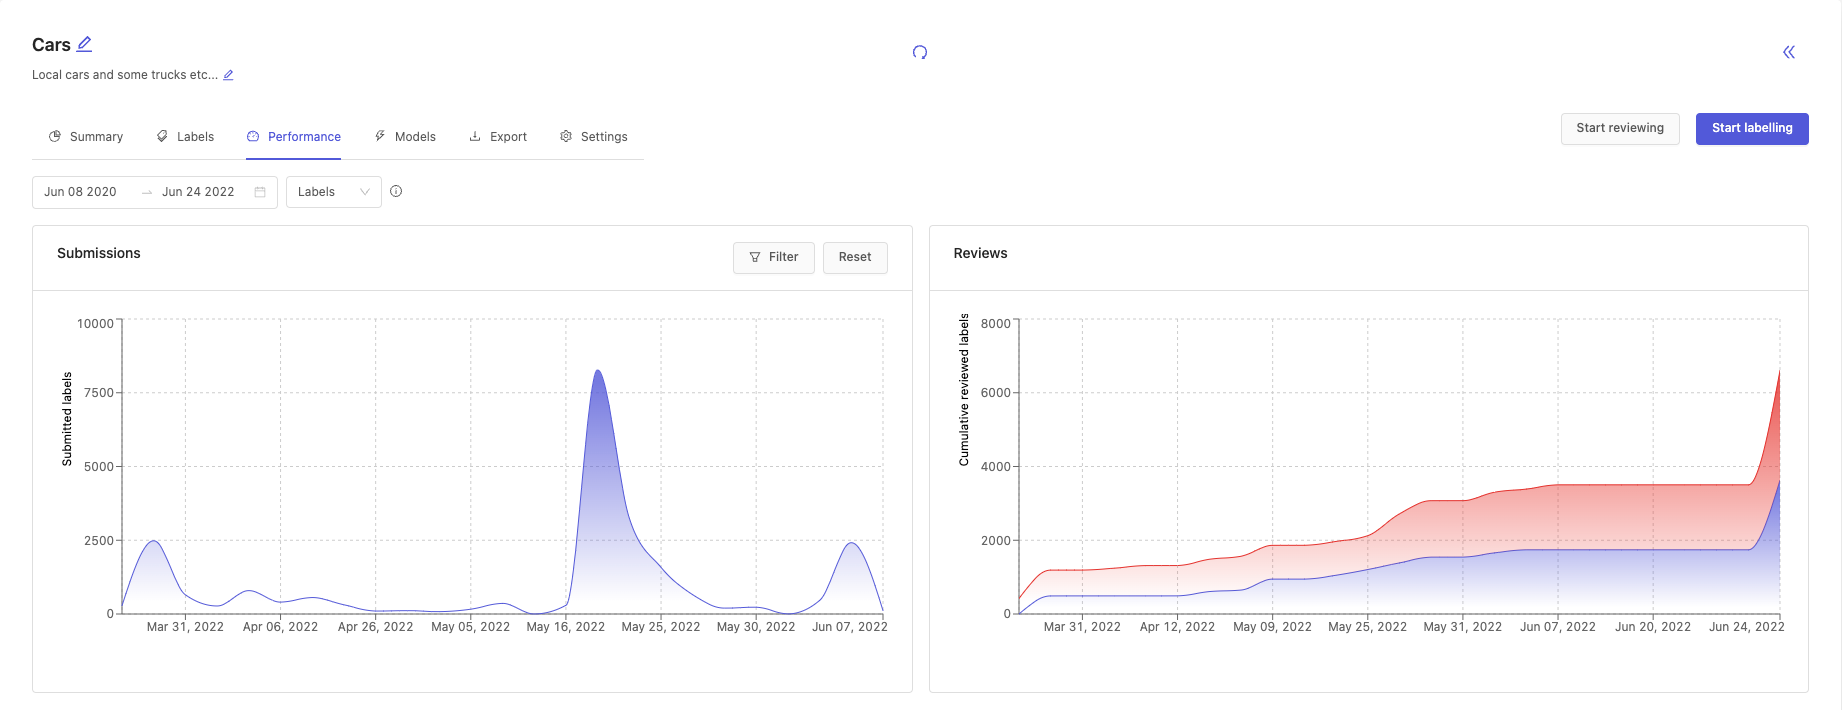

Submissions chart
The submissions chart displays the number of submitted labels or instances over the specified time period. The chart can be filtered to show submissions for specific annotators or classes.
If you filter on both Annotators and Classes then the resulting chart will show the submission statistics for the selected annotators and for selected labels.
Reviews chart
The reviews chart displays the cumulative number of accepted and rejected labels or instances over the specified time period.
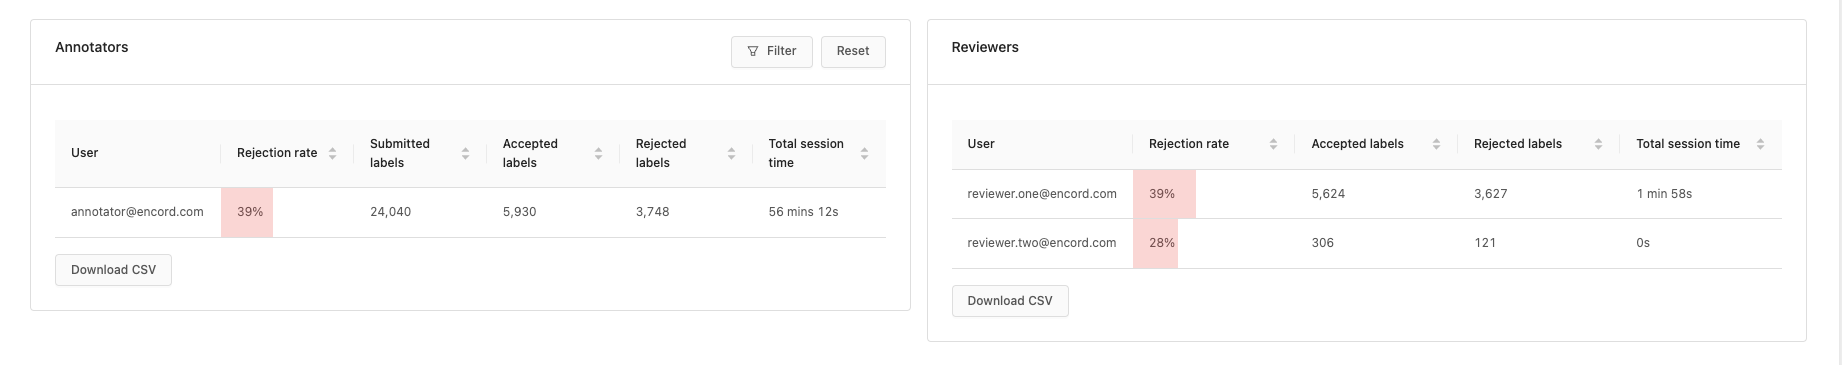
Annotator's table
The annotator's table displays all the relevant statistics for all annotators in a Project. It can be filtered on classes to show annotator statistics only for the selected classes.
- User: The annotator's email.
- Rejection rate: Percentage of their labels or instances that have been rejected in the review process.
- Submitted labels / instances: Number of labels or instances that the annotator has submitted for review
- Repeated submissions are not counted.
- Accepted labels / instances: Number of labels or instances that the annotator created that passed the review process.
- Rejected labels / instances: Number of labels or instances that the annotator created that we're rejected during the review process. Note that this can be higher than the number of submitted labels / instances since a label or instance can be rejected multiple times during the review process but the submission will only be logged once.
- Total session time: Time spent labeling.
Reviewers table
- User: The reviewers email.
- Rejection rate: Percentage of labels or instances that they rejected in the review process.
- Accepted labels / instances: Number of labels or instances that the reviewer accepted.
- Rejected labels / instances: Number of labels or instances that the reviewer rejected.
- Total session time: Time spent reviewing.
Objects and classifications table
Each row in the objects and classifications table can be expanded to show statistics attributes.
- Class: The class name.
- Rejection rate: Percentage of labels or instances rejected in the review process.
- Reviewed labels / instances: Number of labels or instances of the class that have gone through the review process.
- Accepted labels / instances: Number of labels or instances of the class that have passed the review process.
- Rejected labels / instances: Number of labels or instances of the class that failed the review process.
- Avg. time to annotate: Average time spent annotating this class.
Models
Note
The Models tab is only visible to project Admins and Team Managers.
The Models tab is where you attach and manage models for automated labeling. Encord's Apollo allows you to build models for automated data labeling. Please see our documentation on models here.
Export
Note
The Export tab is only visible to project Admins.
Use the Export tab to export your data. Please see our exporting data page to learn how to do this.
Workflow
Note
The Workflow tab is only visible to project Admins and Team Managers.
The Workflow tab lets you view the Project's Workflow, as well as adjust the following:
-
Manage project collaborators as well as collaborators at for each stage within the workflow.
-
Add, remove, or edit Webhooks at the Annotate and Complete stages of the Workflow.
Video Tutorial - Creating webhooks in Workflow Projects
Settings
Note
The Settings tab is only visible to project Admins and Team Managers.
The Settings tab allows you to make modifications to your Project using the following tabs:
- Options - Copy a Project, modify Datasets, modify Ontology, upload annotation instructions, modify Project tags.
- Danger zone - Delete your Project.
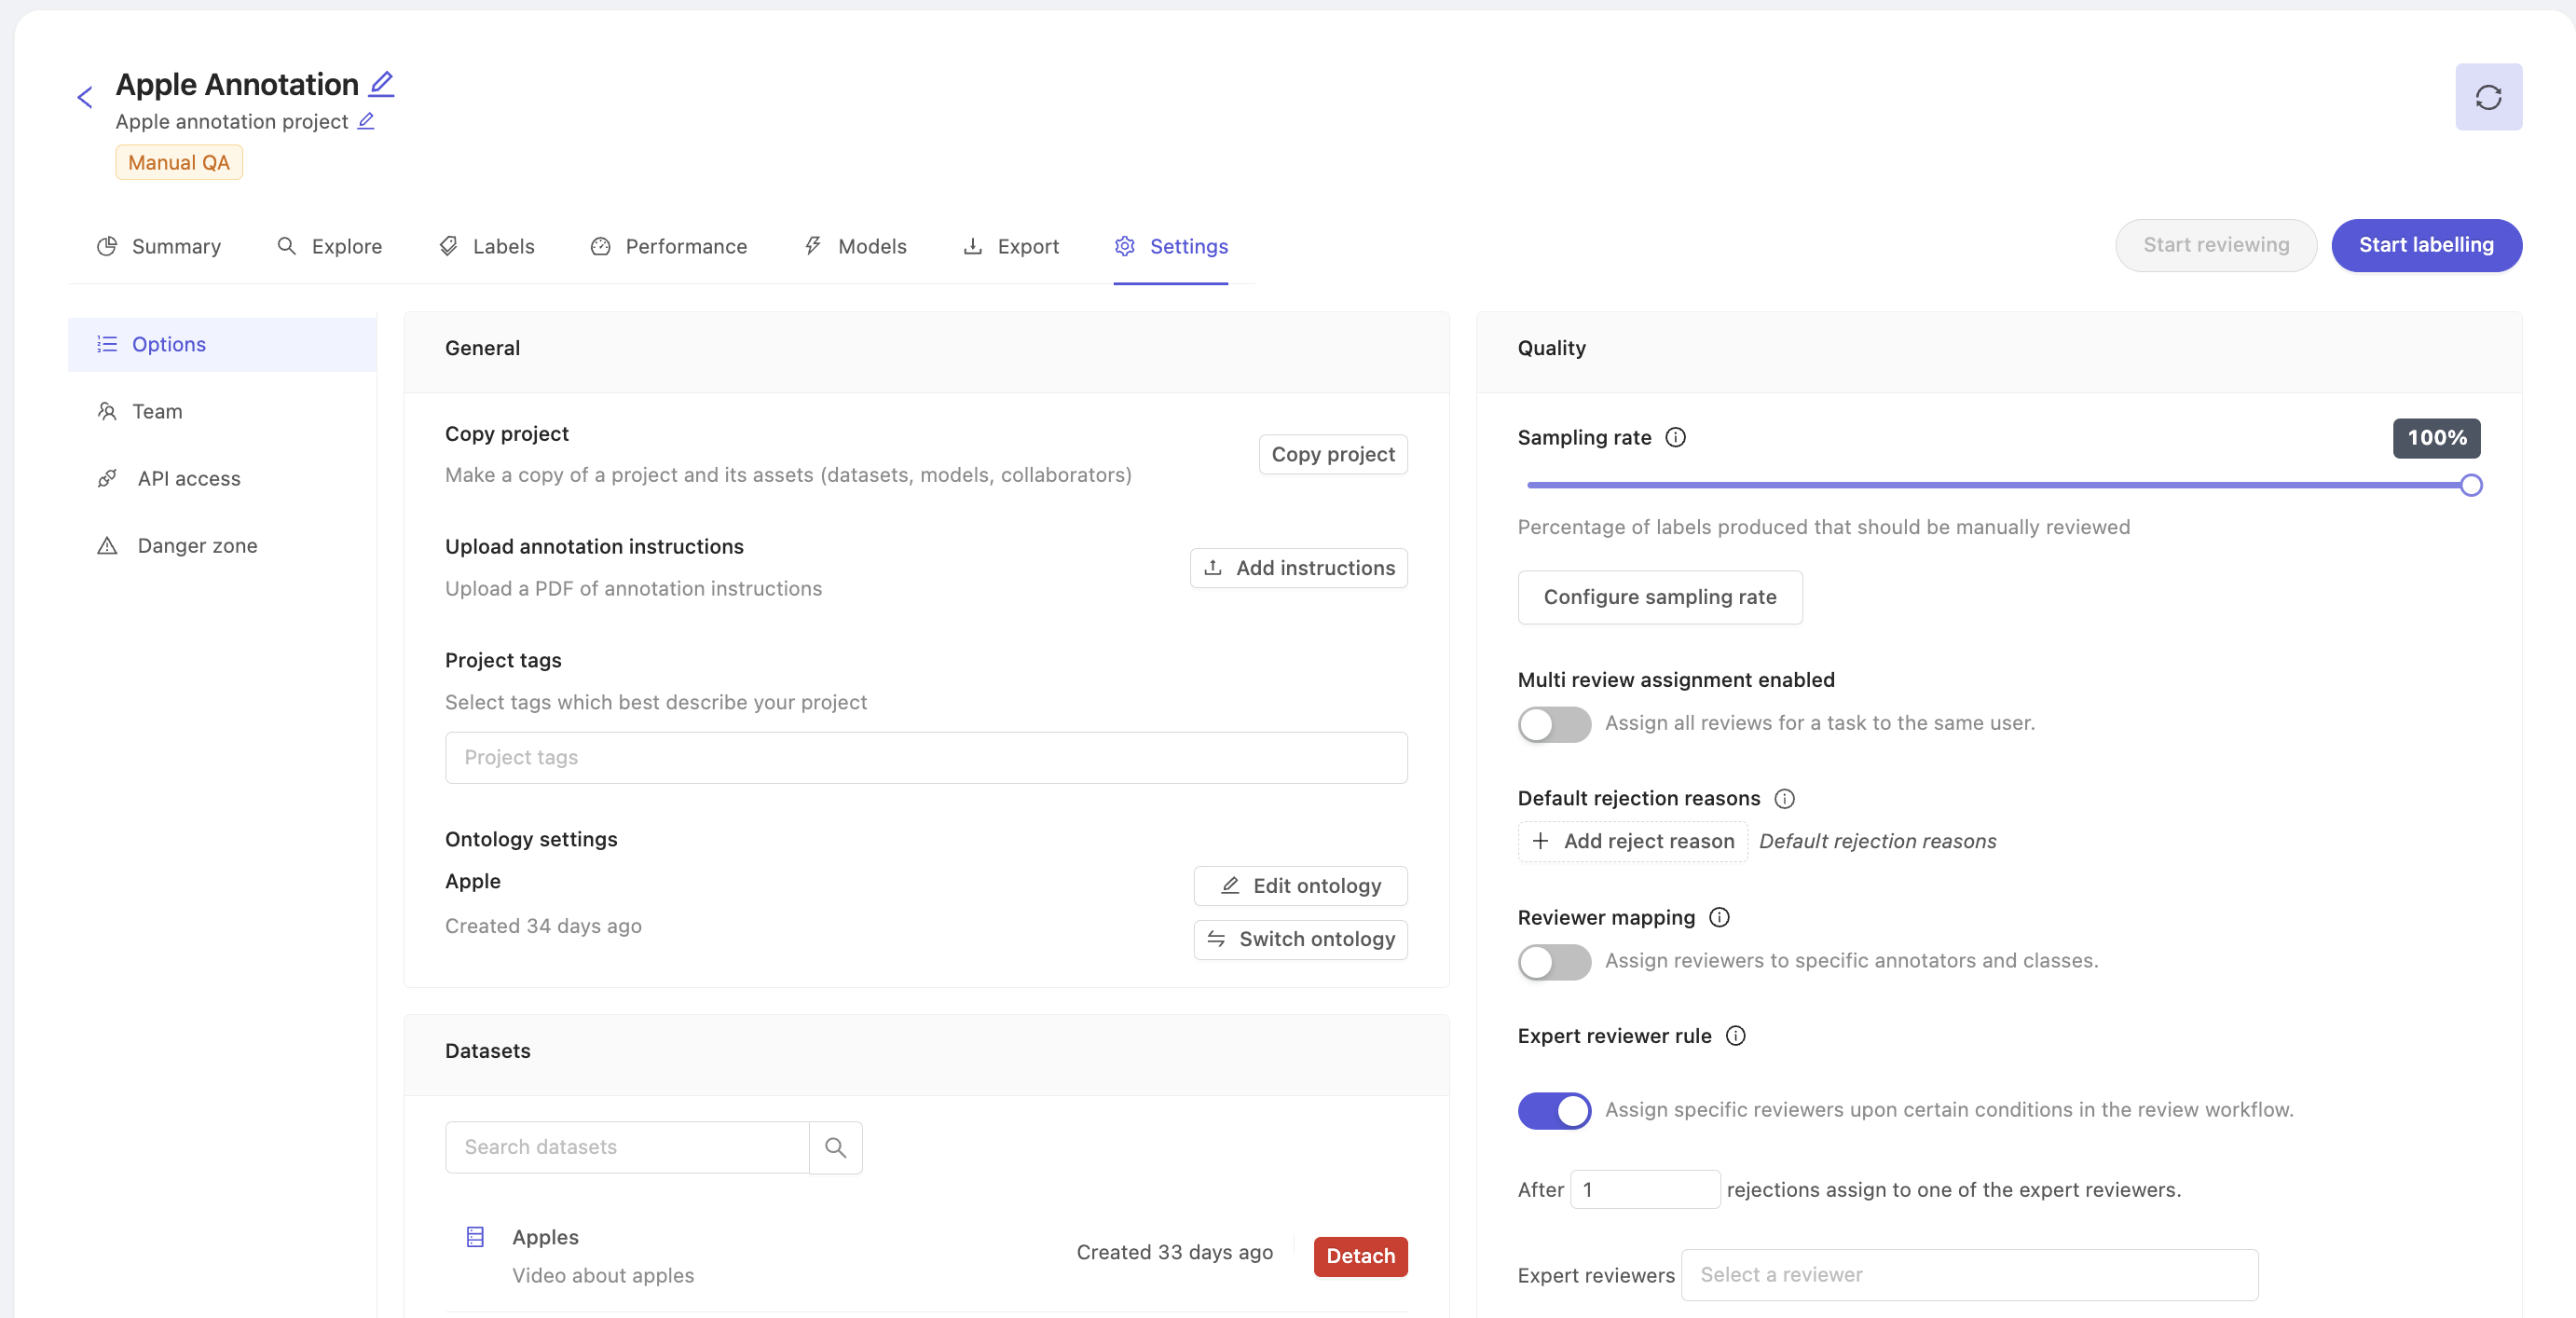
Options
Modify datasets, modify project tags, modify ontology, and upload annotation instructions.
Copy a Project
To copy a Project, click the Copy project button in the Options section of the project's Settings. Select which parts of the project will be copied into the new Project.
Select copy options
Choose the parts of your Project you want to copy into the new Project. The Ontology has to be copied and is therefore always selected. All components of the current Project are selected by default.
You can copy any combination of the following assets:
- Datasets: all datasets are copied. New annotation tasks will be created for all videos and image sequences if their labels are not copied over.
- Labels: copy the labels in specified data units. All labels are copied by default. Change the dropdown to Selected Labels ,as seen in the image below, to only include specific labels in your new project. Click the +Advanced settings button to select the state of the data units labels should be copied for.
- Models: this will copy all the models in your project along with their training logs.
- Collaborators: copy all project users with their respective roles. Project admins are copied regardless of whether this is selected.
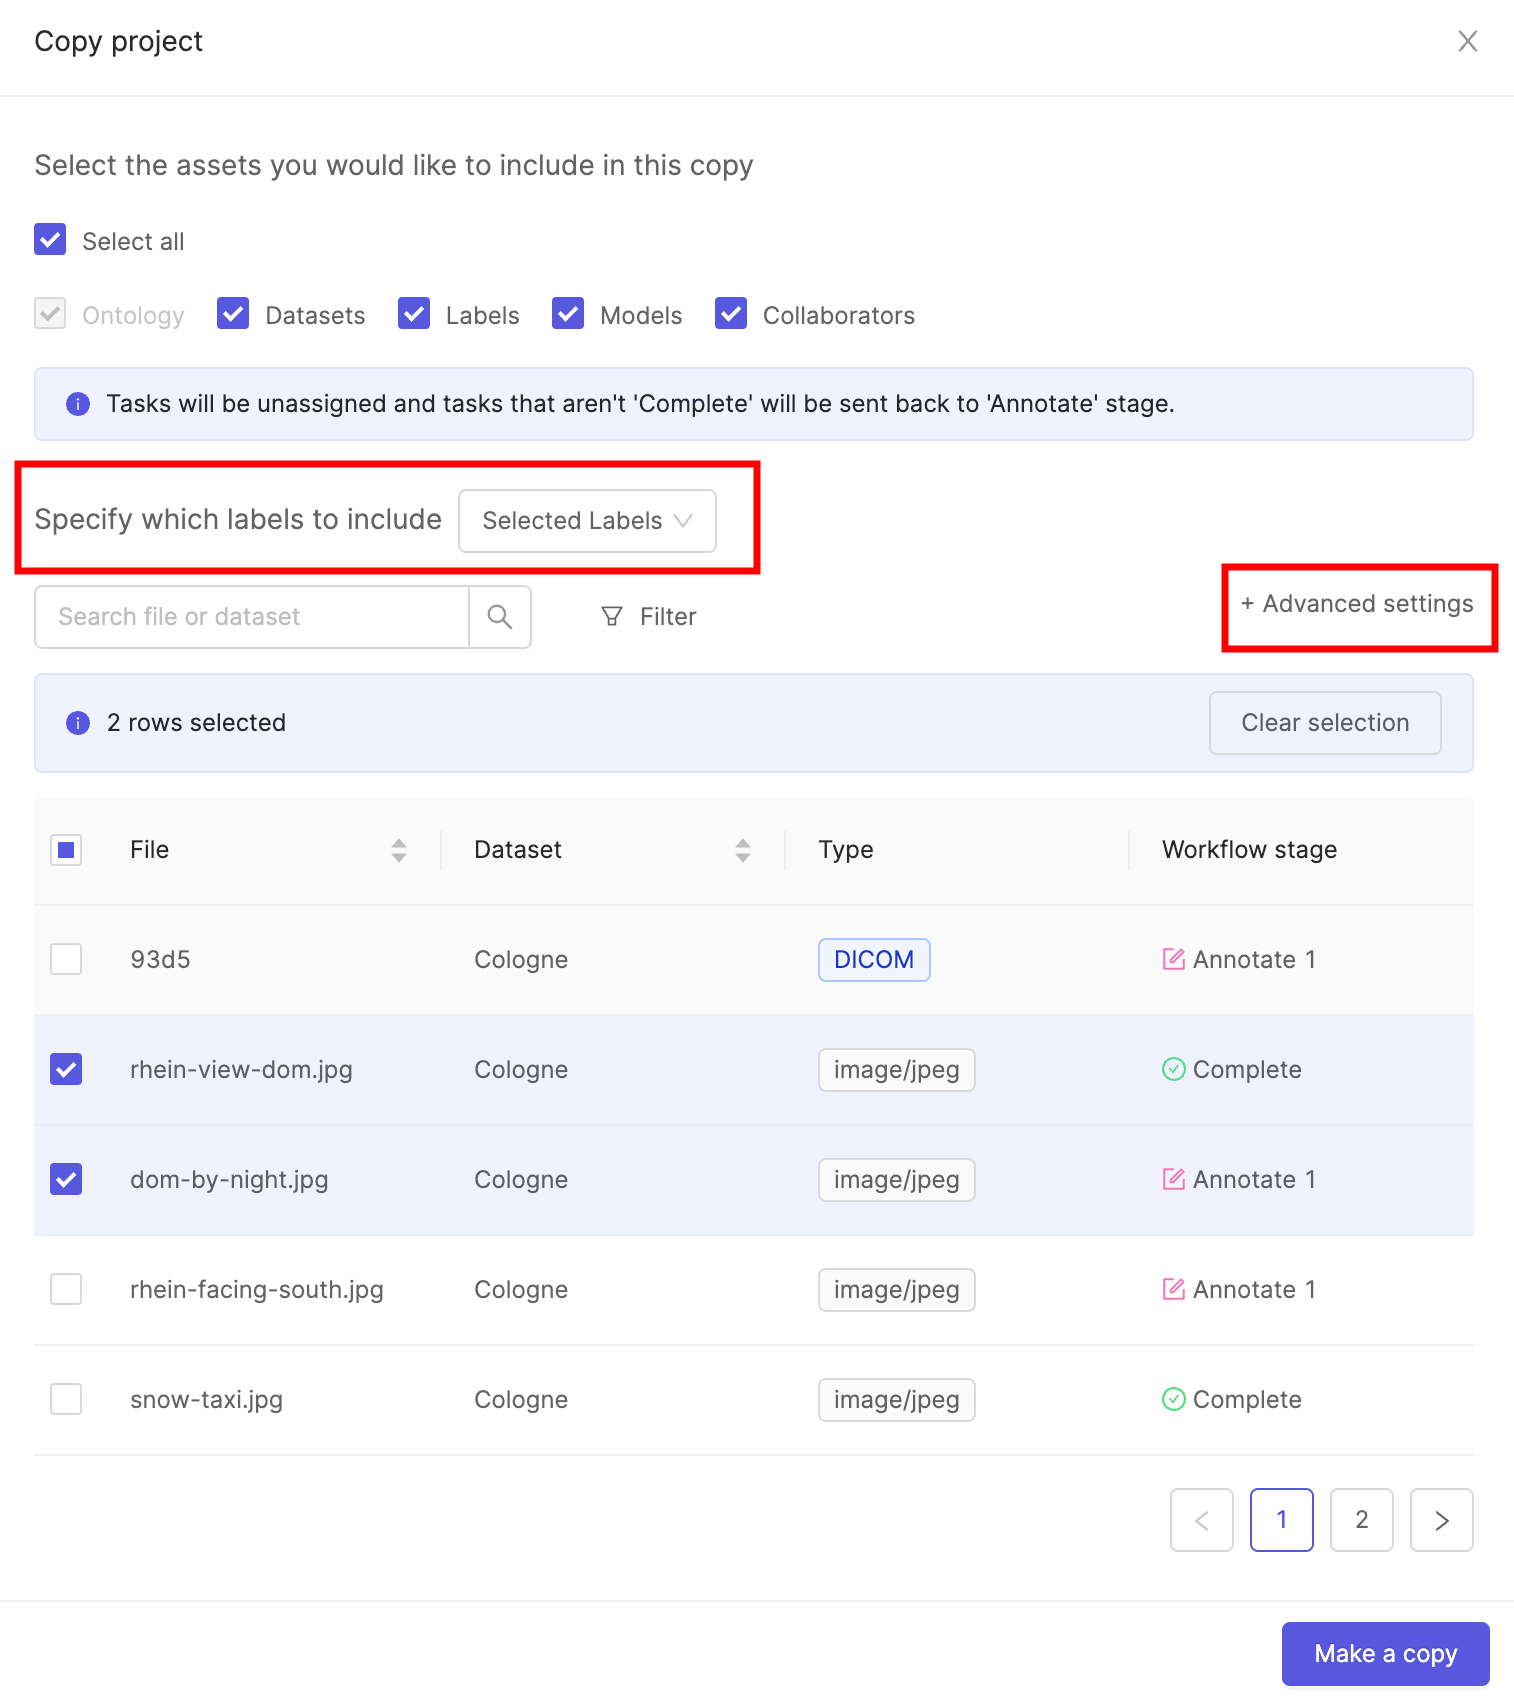
Click the Make a copy button to copy the Project with the specified components.
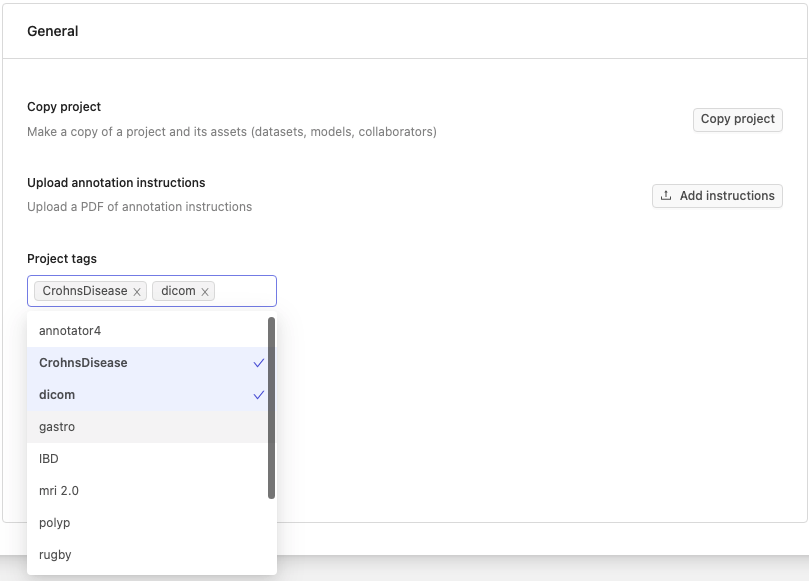
Upload annotation instructions
-
Click the Add instructions button to upload instructions for your annotators in PDF format.
-
To ensure the best possible results, provide as much detail as possible about what you would like annotated and how precise bounding boxes should be drawn. For example, instead of saying 'person', consider defining what should constitute a person for your annotators - only a full person? A torso? Or should any part of a person in a frame be labeled as a 'person'?
Note
The more specific your annotator instructions, the higher the chances that your annotators will perform well.
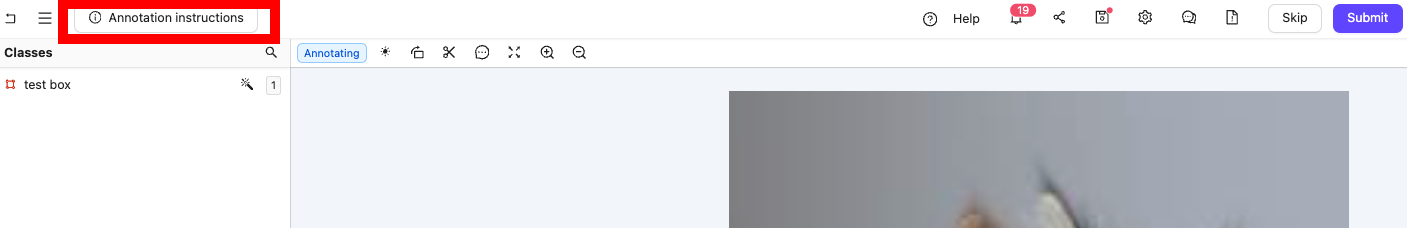
- Once uploaded, annotation instructions will be accessible within the Label Editor, or the Workflow tab of your Project.
Project tags
Note
Tags are created and managed on the Organization level. Once created they can be added to individual Projects.
You can add tags to a Project if you are part of an Organization.
Project tags allow you to:
- Flexibly categorize and group your Projects.
- Filter your Projects.
Adding and removing tags
You can add tags to your projects in:
-
When creating a project.
-
In the Settings page of a Project.
To add tags to your Projects in the Settings page, navigate to the Options tab and click the Project tags drop-down. Here you will see the available tags in your organization. Click on a tag to add it to a Project. You can remove a tag from your Project by clicking the same tag again, or clicking the x button next to its name.
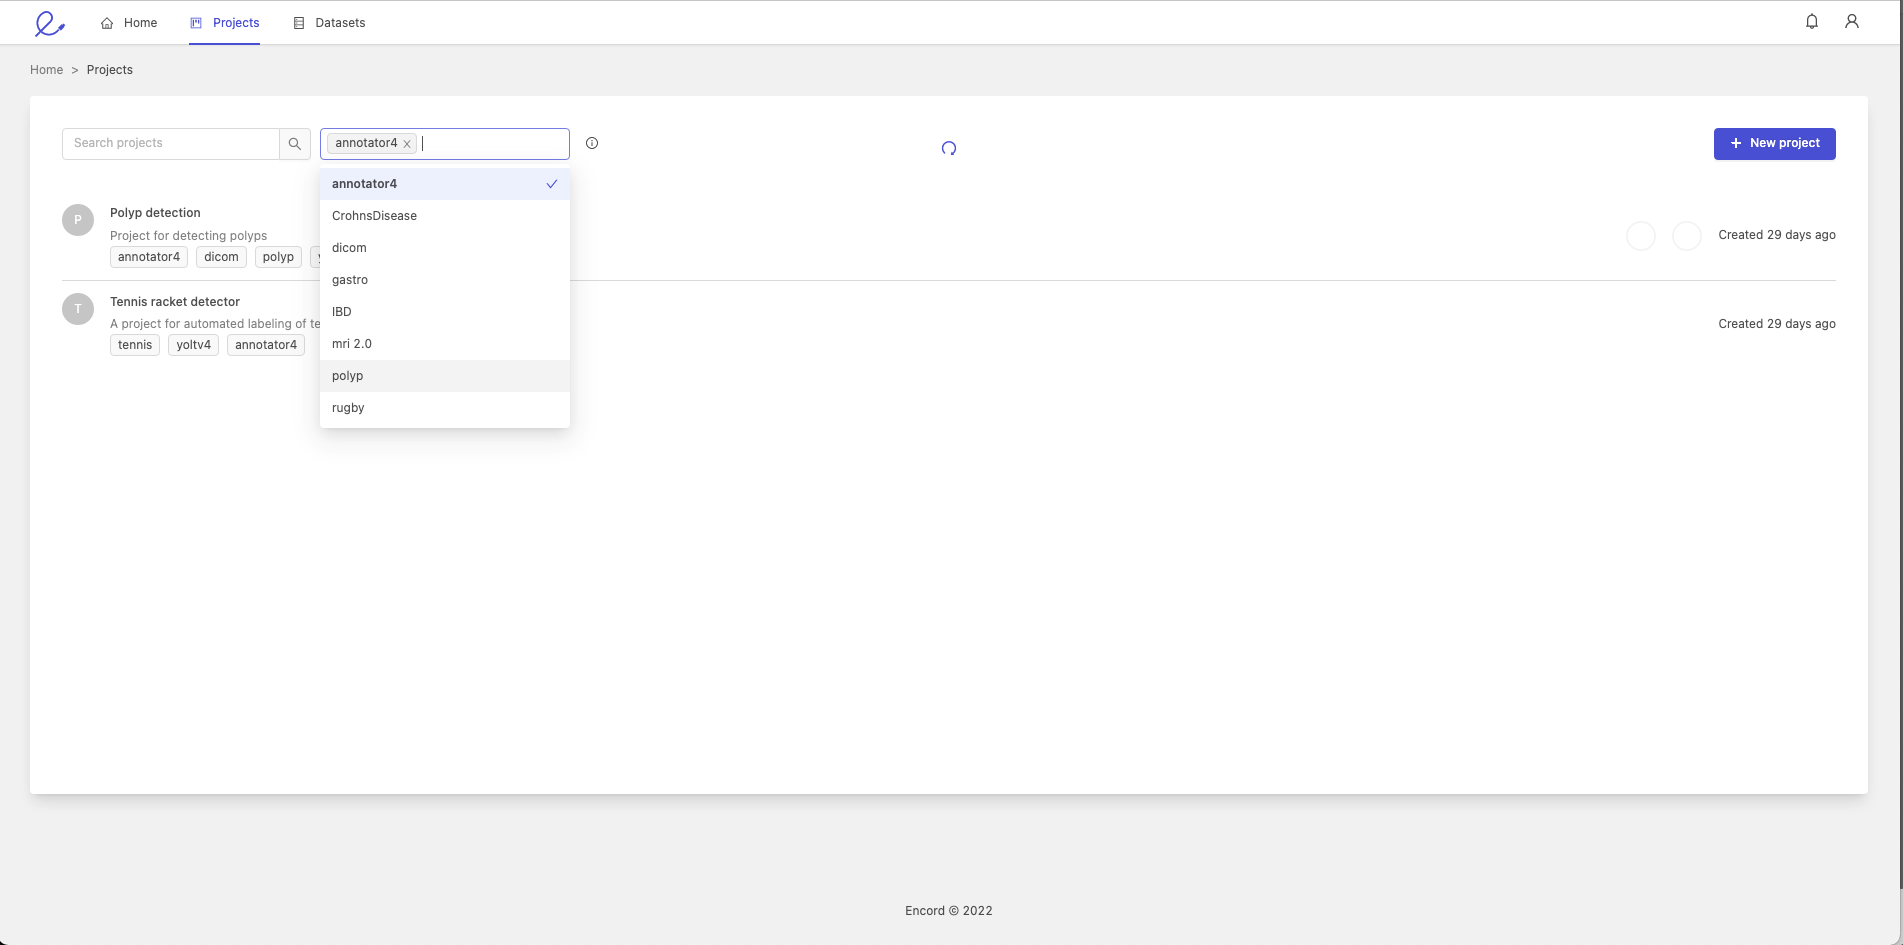
Filtering projects by tags
You can filter your Projects based on the tags they contain. To do so, click on the 'Projects tab' in the Navigation bar, click the 'Filter by tags' drop-down and select one or more project tags. This will result in only projects with the tags being selected being displayed.
Edit Project Ontology
You can view or switch the Ontology attached to your Project.
Note
Changing the Ontology can render existing labels invalid and lead to data inconsistency.
-
Click the Switch ontology button to switch the Ontology linked to your project. The resulting pop-up allows you to choose an existing Ontology from a list, or create a new ontology for this project.
-
Click the View ontology button to view the details of the Ontology that is attached to the current Project.
Edit datasets attached to a Project
The Datasets section allows you to attach or detach any number of datasets to your Project by clicking Manage. You must create a new dataset in the Datasets section for it to become available in a Project's settings.
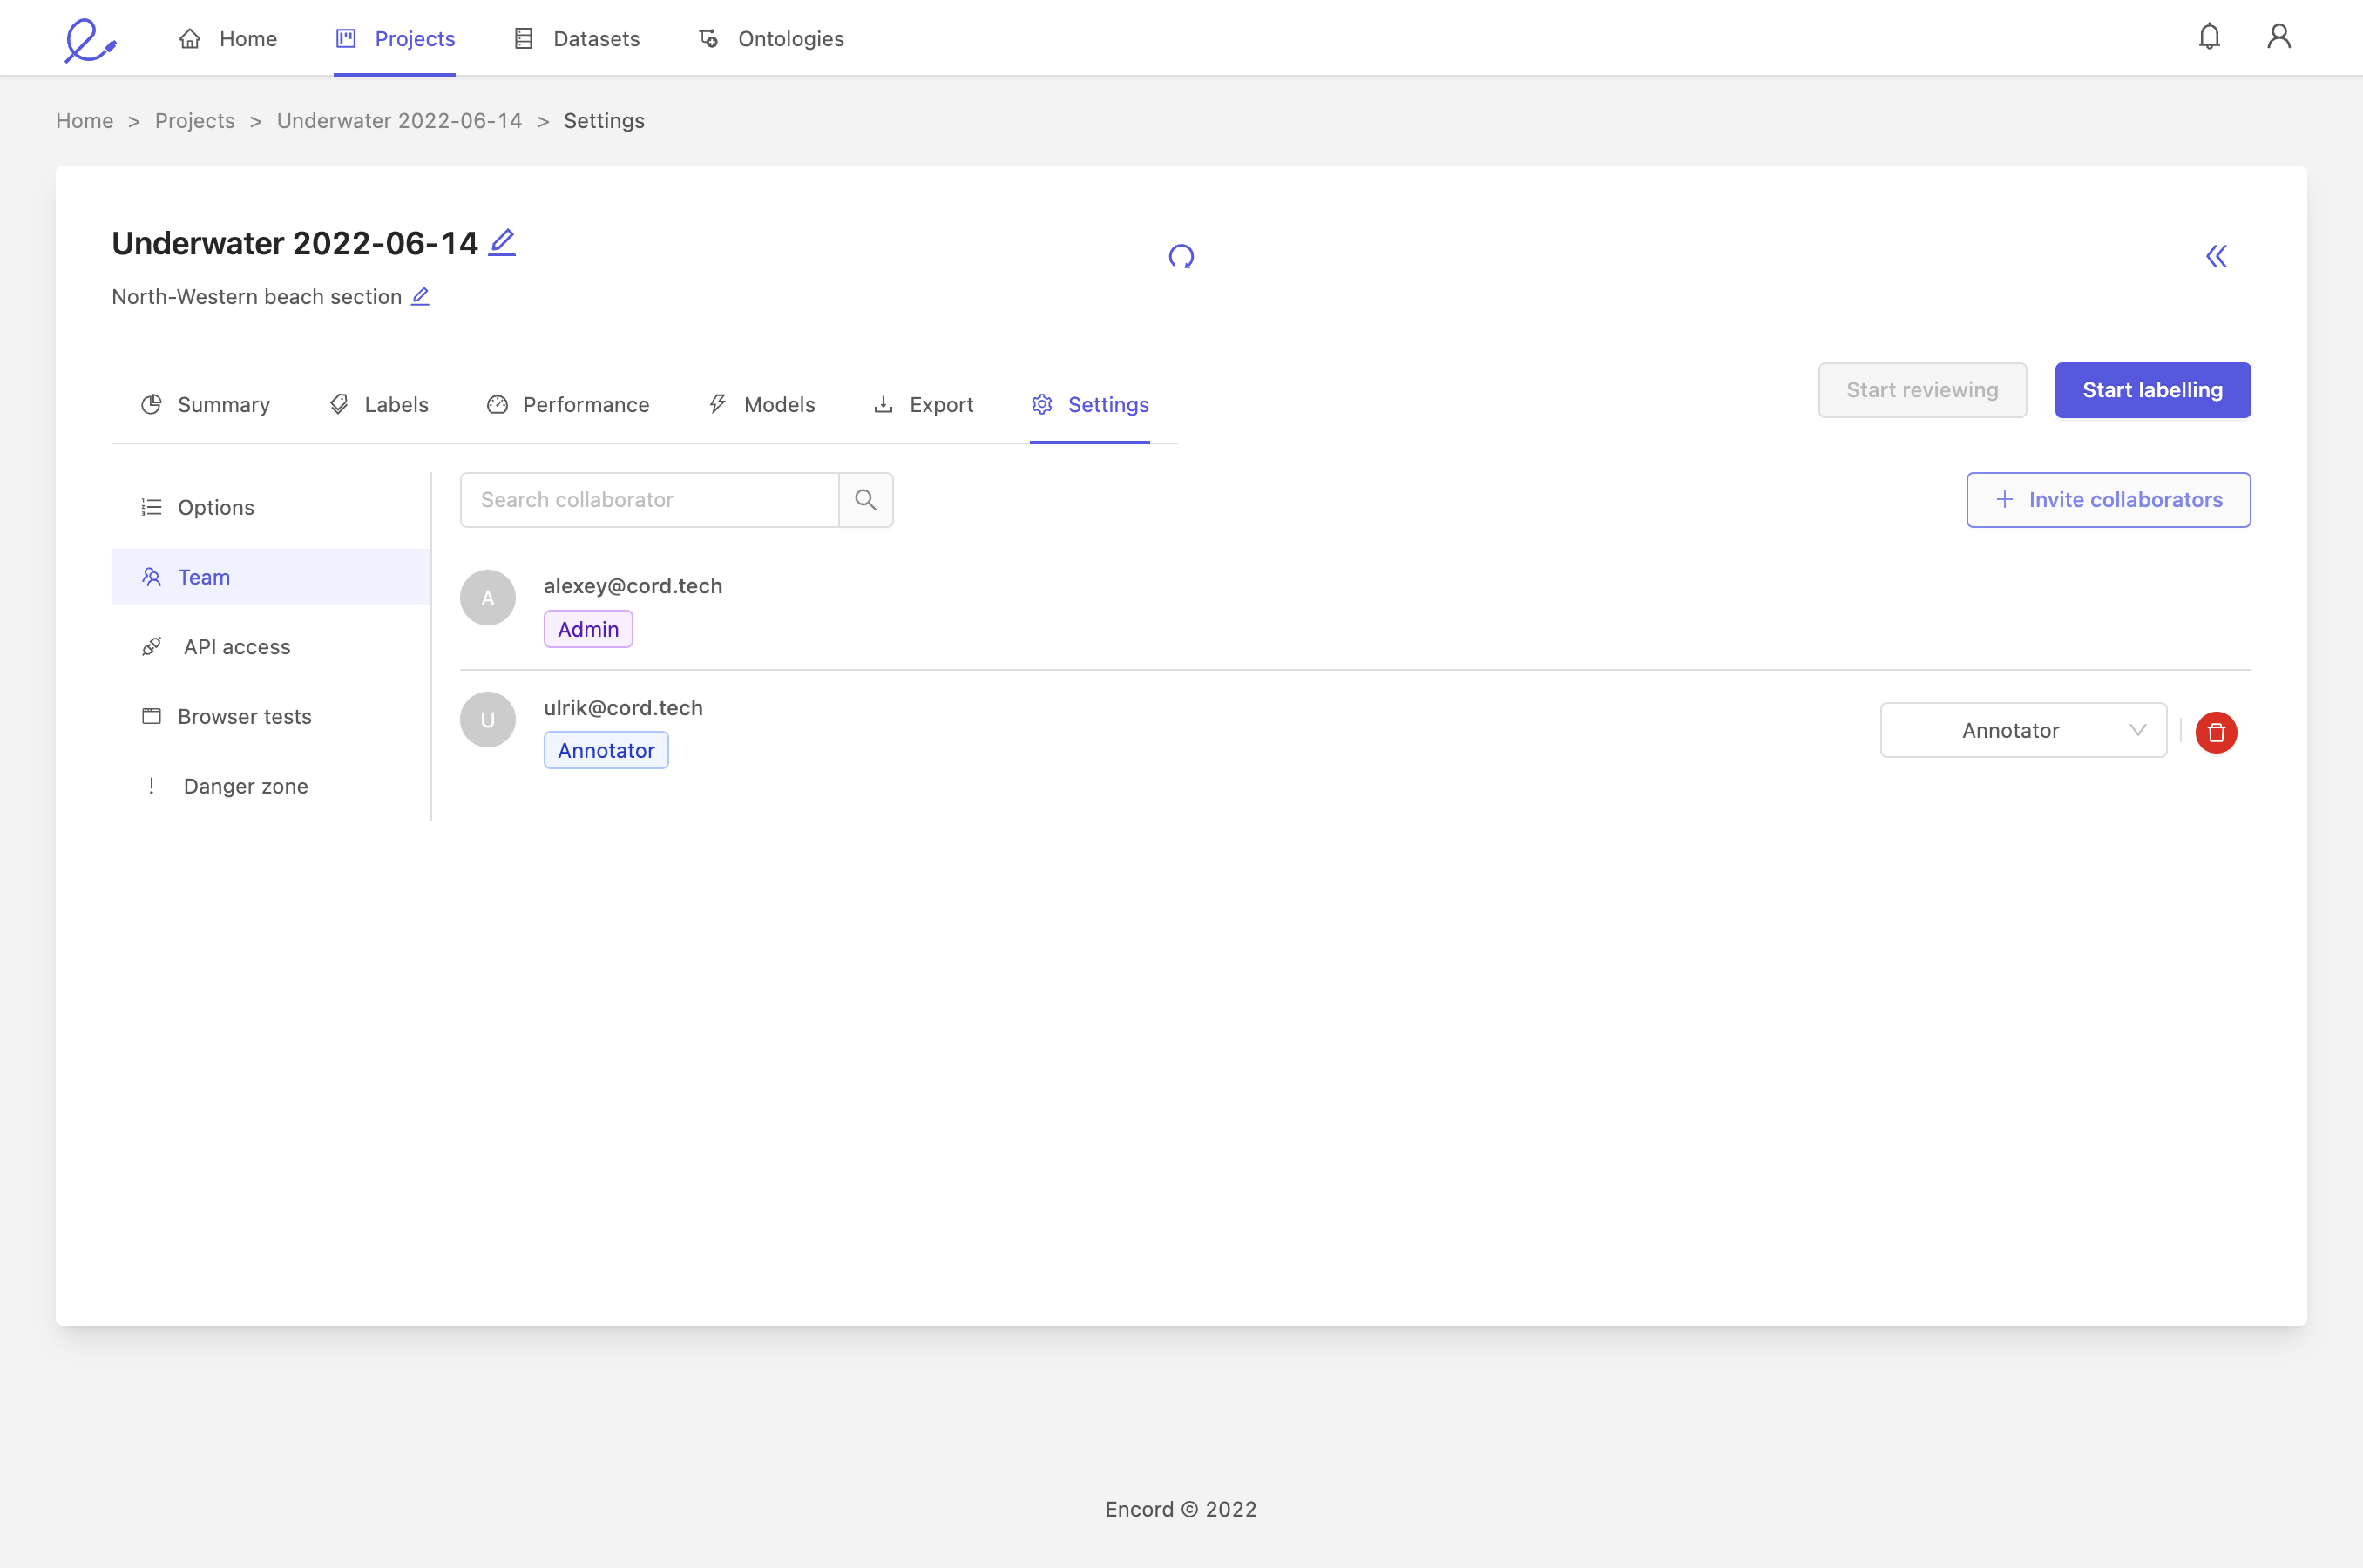
Team
To manage project collaborators, select the Team pane in your project Settings.
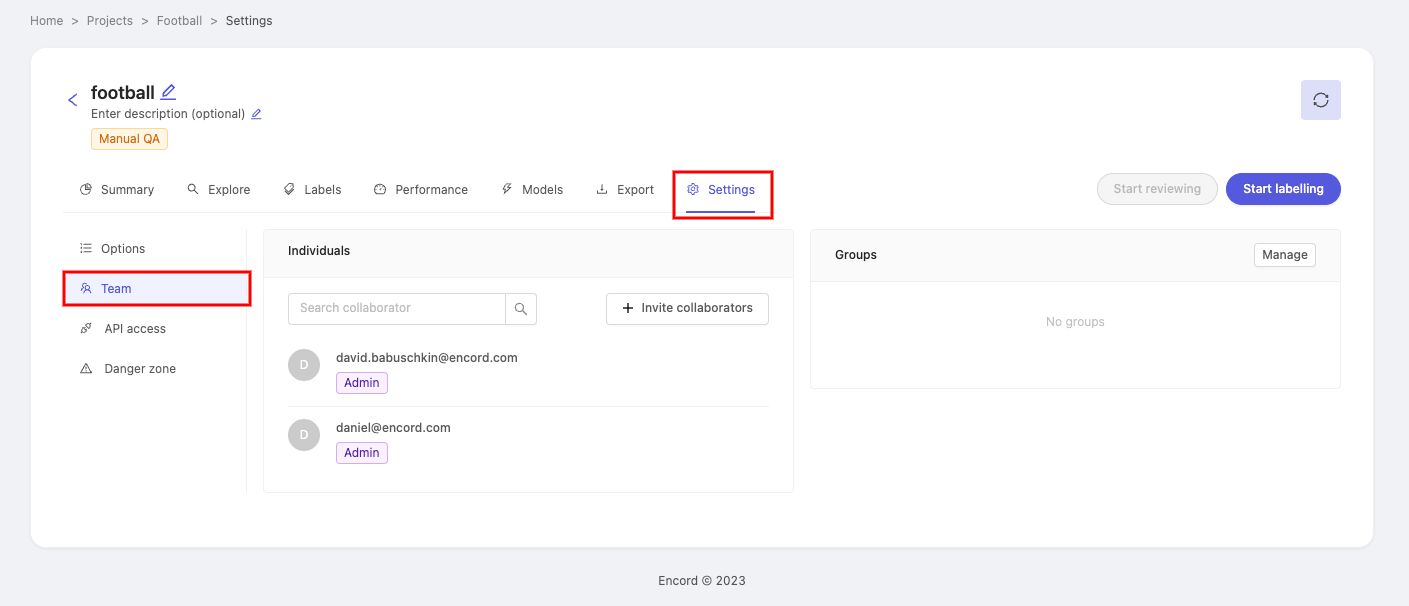
Here you can invite collaborators to the Project, and configure their roles.
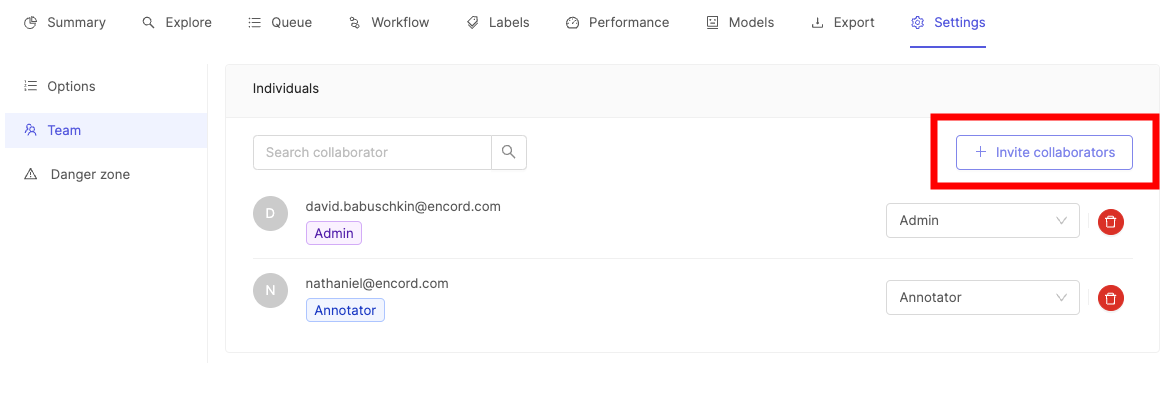
Add collaborators
To invite collaborators from within your Organization to the Project:
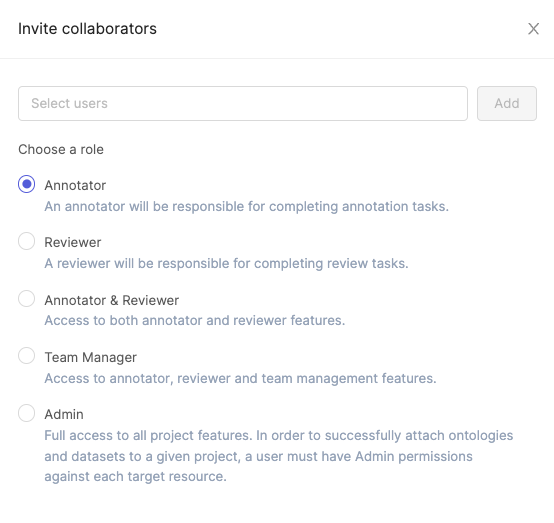
- Click the + Invite collaborators button. This opens a new window where you can enter email addresses of the people you would like to invite.
-
Select a user role for the collaborator you want to add by selecting an option from the list.
-
Type the email address of the user you'd like to add and select the user from the list.
-
Click the Add button to add the user with the specified role.
2. Add collaborators as a group
Note
To add collaborators as a group, your organization needs to have user groups. Navigate to our documentation on creating user groups for more information.
Collaborators can be added to a Project as a group - which can save time as well as ensure that no individual is forgotten.
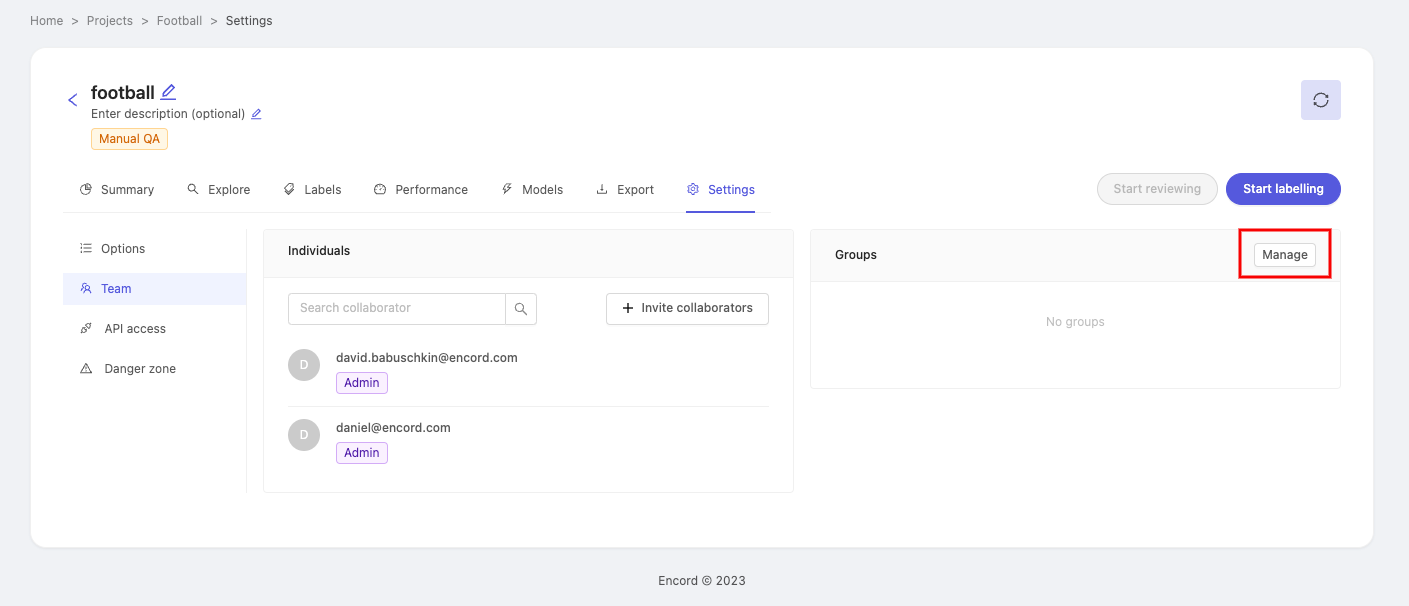
In the 'Groups' section of the page, click on Manage to make the 'Manage Groups' pop-up appear.
Click the Select group drop-down and pick a group you want to add as collaborators. After selecting a group, click the Select Role drop-down to assign a role to the group of collaborators. Click Add to add the group.
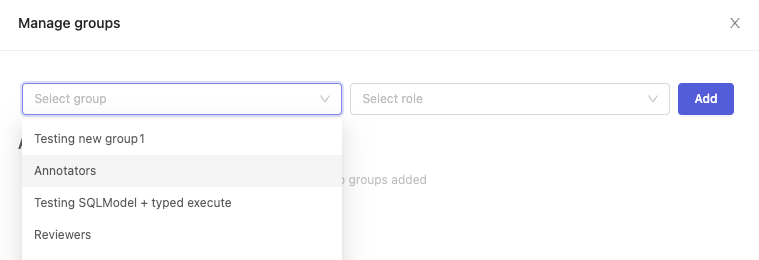
The group you just added will appear under the 'Added groups' heading. Repeat the process if you'd like to add more groups with different roles to the Project.
Tip
To delete a group from the Project, simply click the
button next to the group name.
2. Change collaborator role
A project admin can modify the different roles of collaborators, using the drop-down on the right.
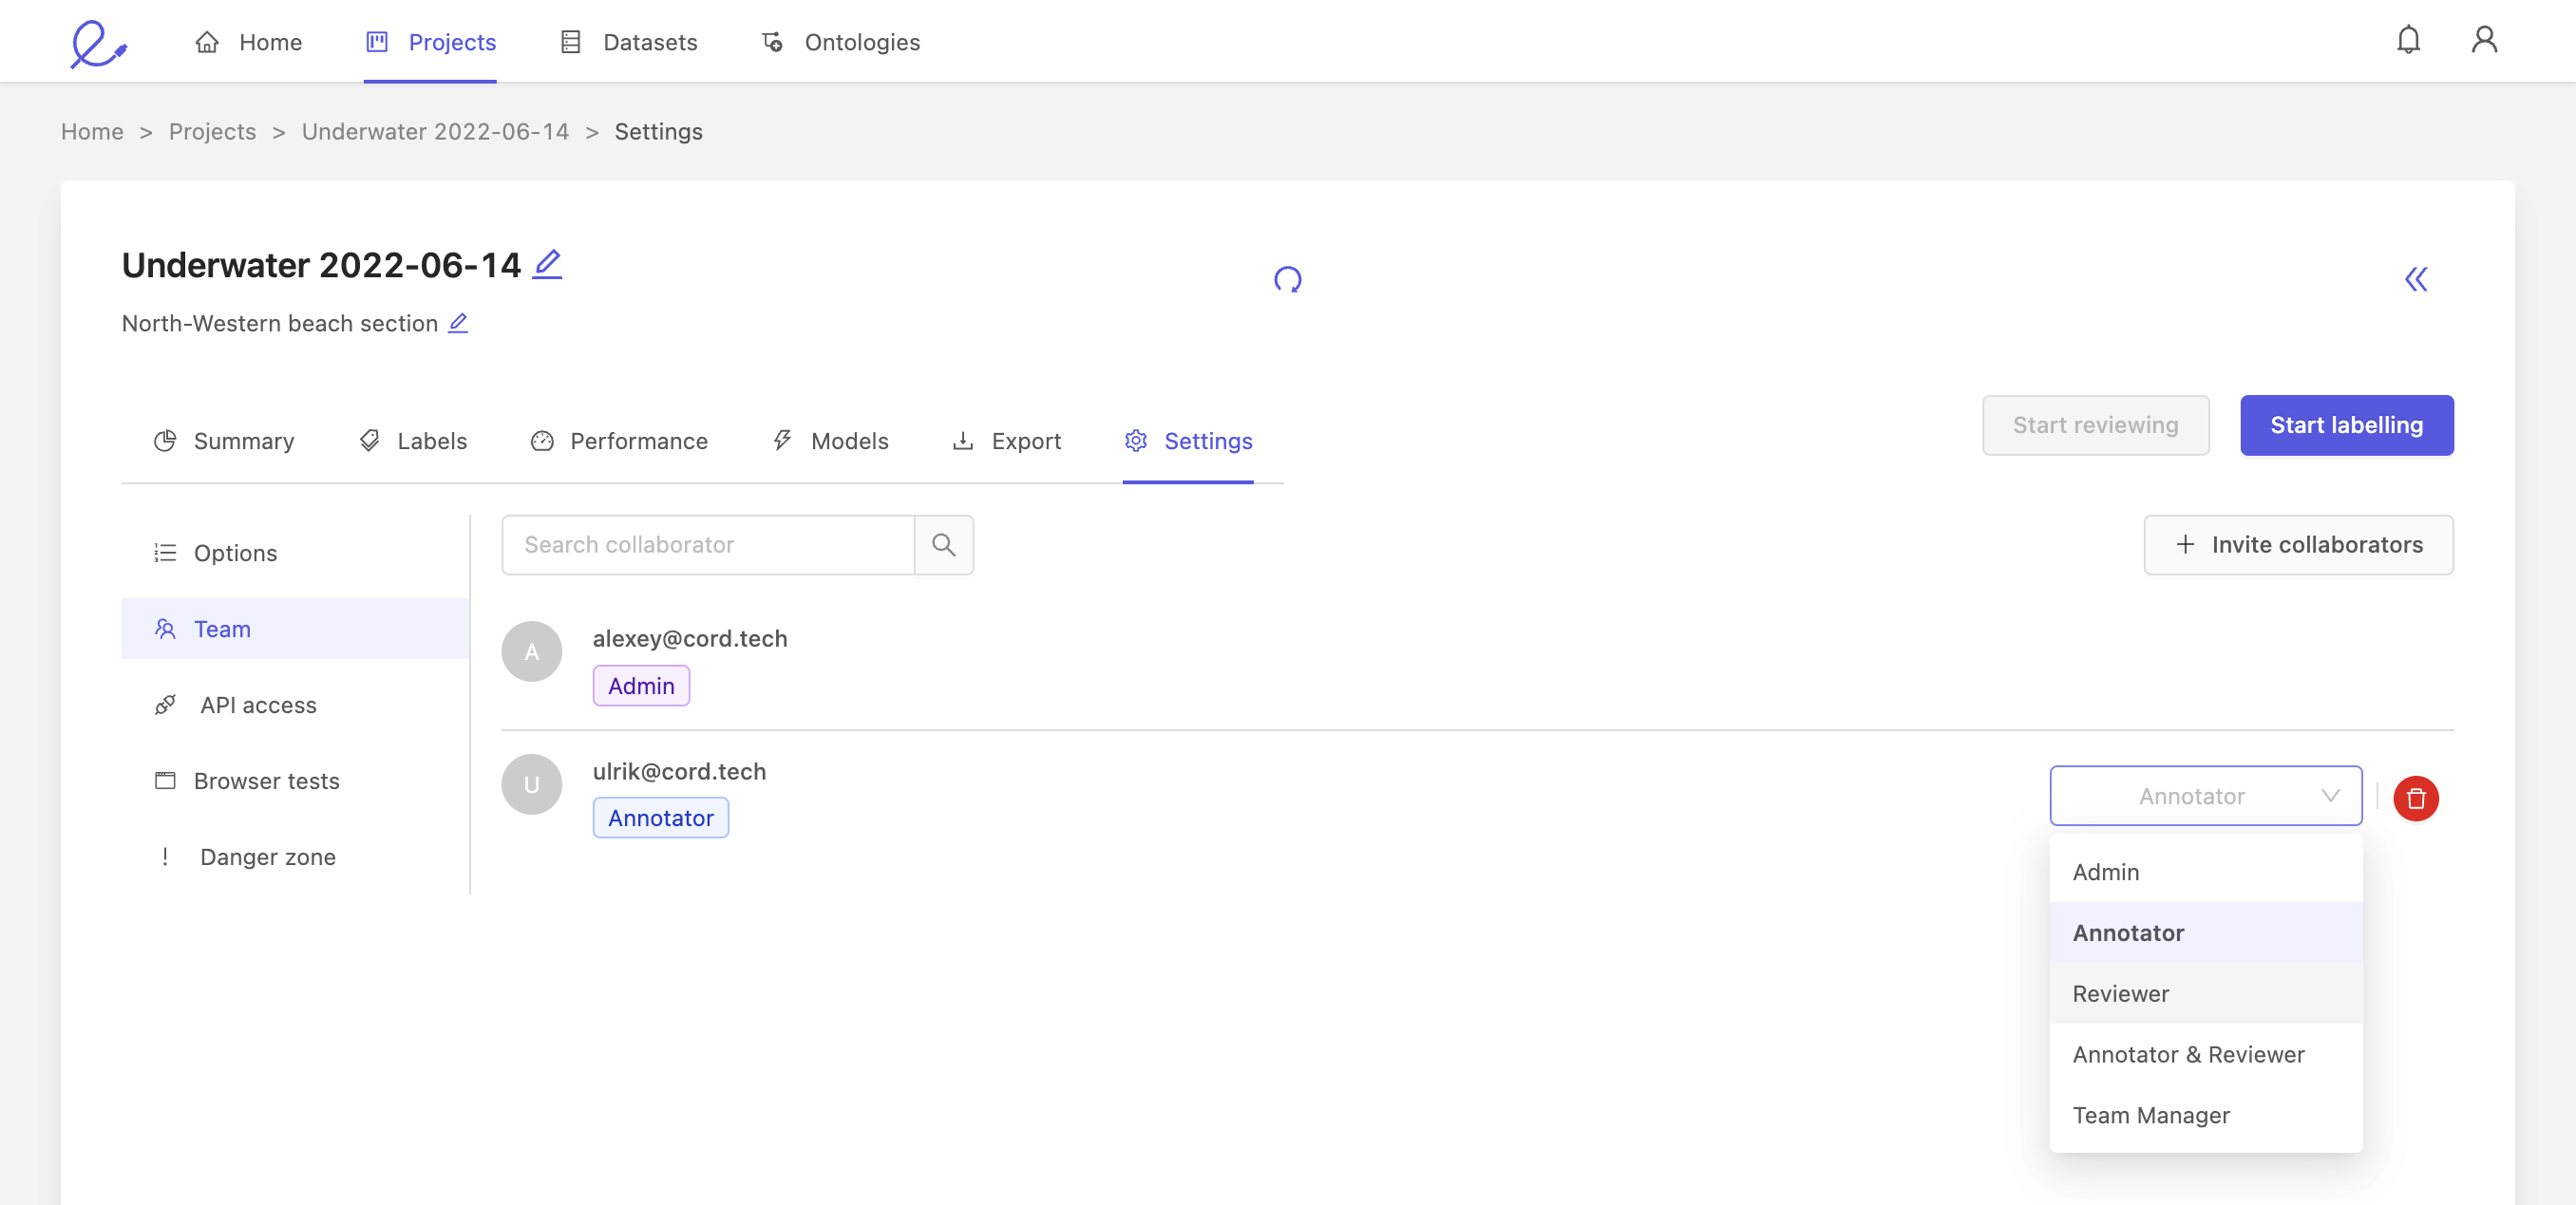
You can assign the following roles to collaborators:
- Annotator: annotators are responsible for labeling. This is the default role for all collaborators.
- Reviewer: for reviewing labeled tasks.
- Annotator & reviewer: a combination of annotator and reviewer.
- Team manager: a team manager can assign tasks to other users, and add collaborators to the project.
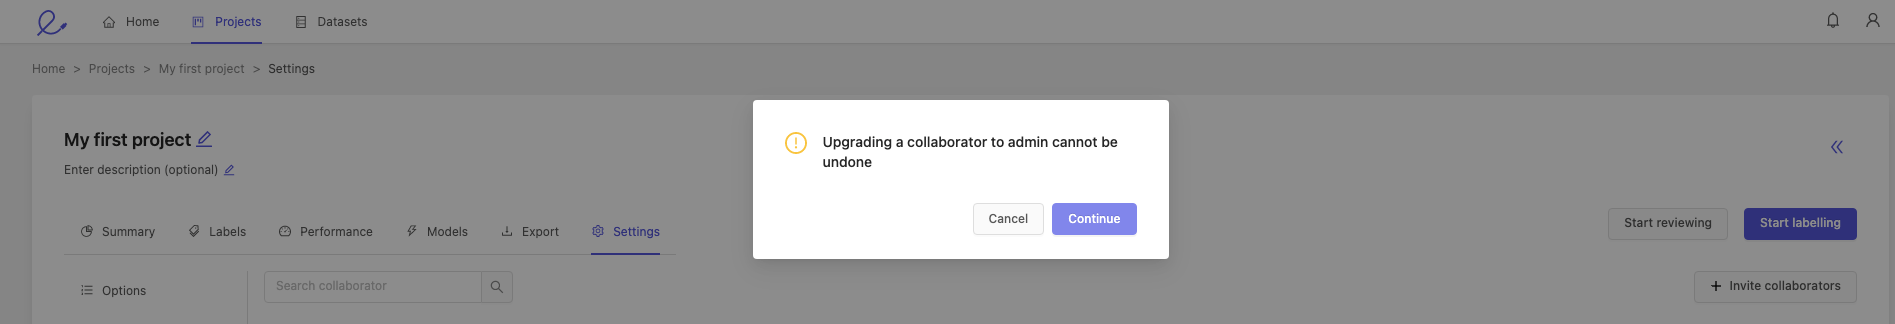
- Admin: gives this collaborator full administrative control over this project. Caution: this is an irreversible action.
Confirm your selection when making a collaborator a project admin.
Danger zone
You can delete your Project by going to the Danger zone tab at the bottom of the menu, and clicking the red Delete project button.
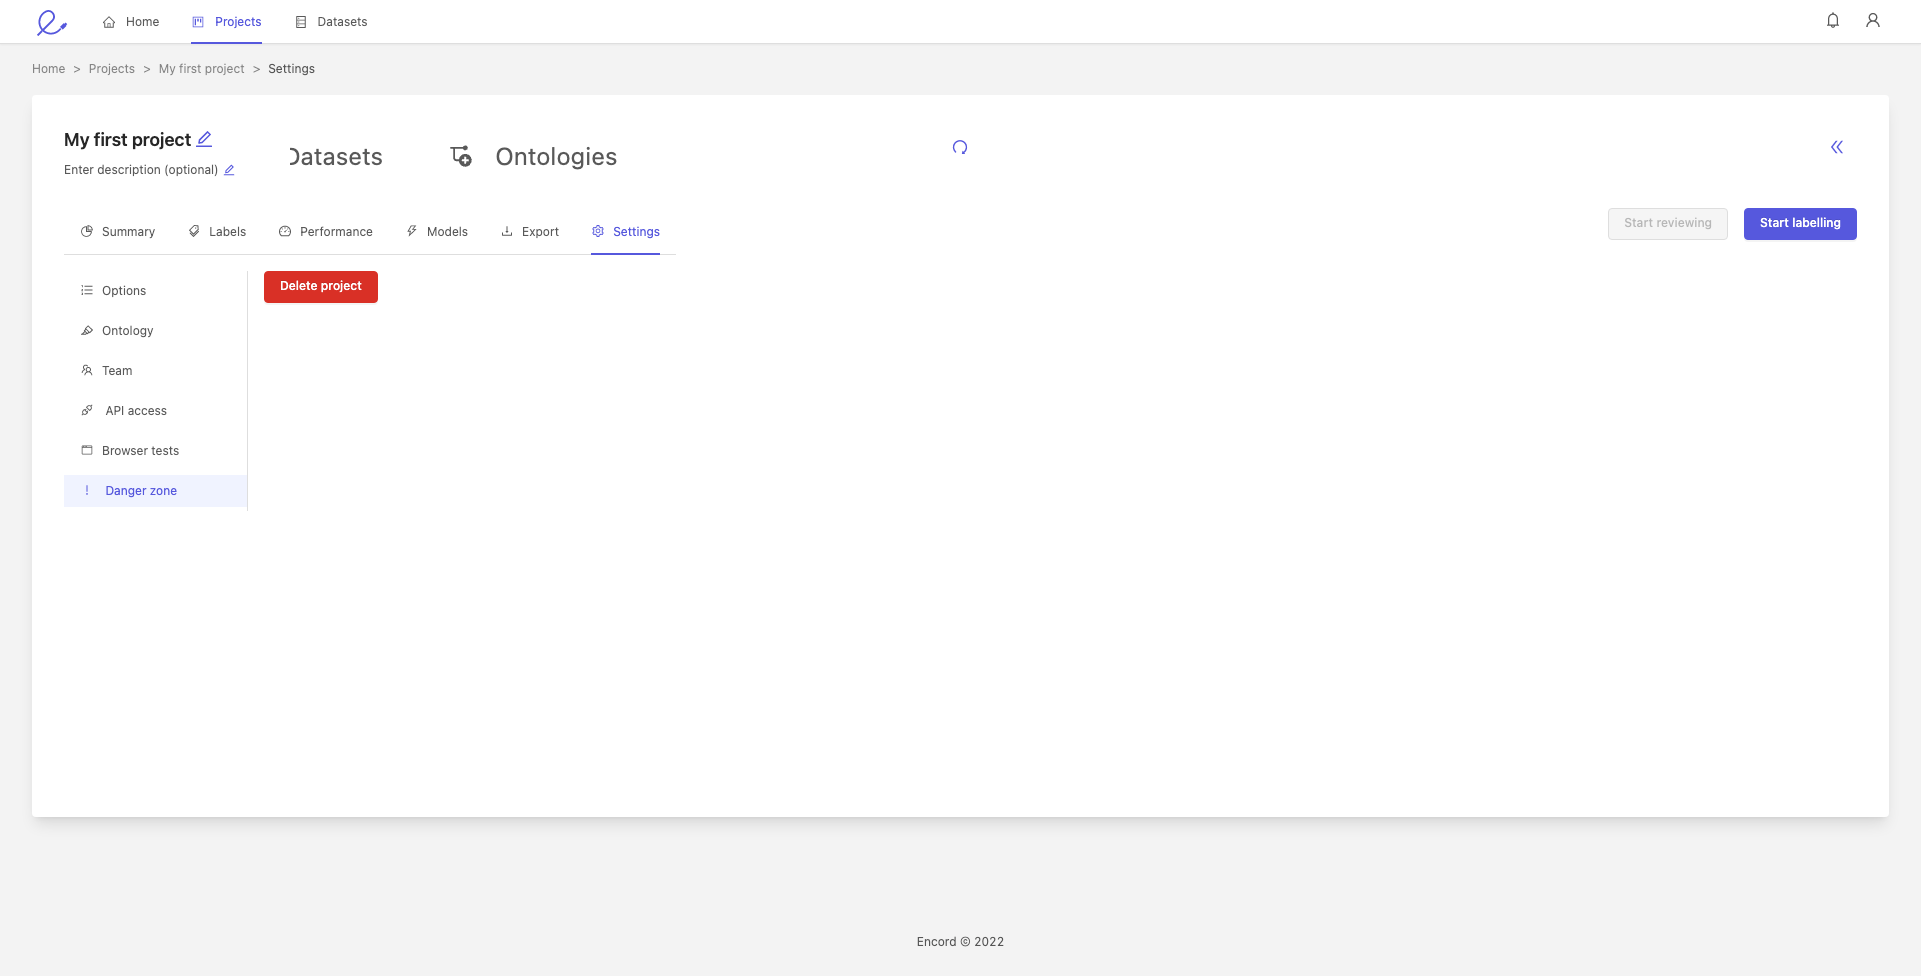
Caution
Deleting your project does not delete the datasets in the project, but will delete the project's labels and ontology.
Updated 6 days ago