Model Predictions and Evaluation
Note
Predictions must be imported to Active, before you can use the Predictions feature on the Explorer page and the Model Evaluation page.
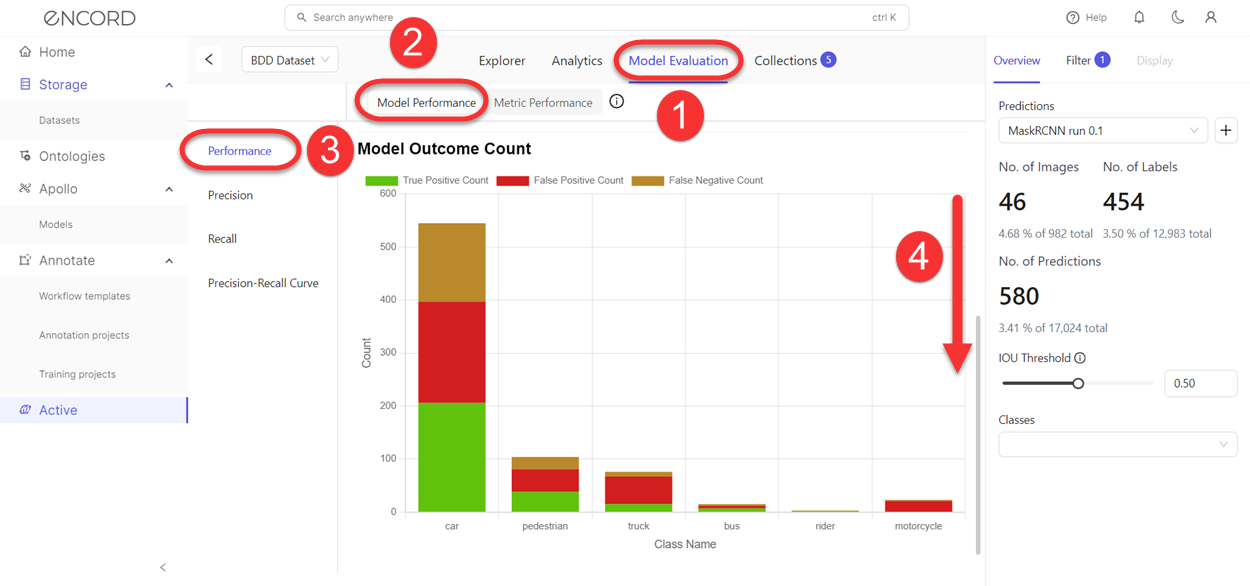
Encord Active enables you to visualize the important performance metrics (Average-Precision (mAP), Average-Recall (mAR), F1, True Positive Count, False Positive Count, False Negative Count) for your model. Performance metrics can be visualized based on different classes and intersection-over-Union (IoU) thresholds. Active supports performance metrics for bounding-boxes (object detection), polygons (segmentation), polylines, bitmasks, and keypoints.
Dragging the IOU slider changes the scores.
You can also choose to see the aggregate score for certain classes by selecting them in the drop-down.
How are Prediction Metrics calculated?
Model performance metrics (mAP, mAR, Accuracy, F1-score) and model prediction types (True positive, false positive, and false negative), for bounding-boxes polygons (segmentationx), polylines, bitmasks, and keypoints, are calculated using Annotate’s labels as the “ground truth” for your imported predictions.
Important Information
Before going any further, you need to be aware of the differences in behavior between pycoco/TorchMetrics map calculations and Encord's.
The comparions here were done using ‘torchmetrics=1.2.1’, ‘pycocotools=2.0.6’, and Encord Active.
Difference 1
TorchMetrics ignores a class in the mAP calculation (average AP over classes), if there are no ground truth labels of that class in all the images being looked at. Active includes classes in the mAP calculation even if there are no ground truth labels of that class in all the images being looked at
Why did we do this? Because Encord Active is inherently dynamic and meant for decomposing model performance based on arbitrary data subsets. This makes model performance more transparent because predictions are not excluded from the performance scores.
Difference 2
There is a slight difference in the TP matching algorithm. Encord does not have a prediction match against a different ground truth with a smaller IOU than the initial candidate ground truth if some other prediction with higher confidence matches as a true-positive against that original ground truth, but torchmetrics does. This can result in differences compared to TorchMetrics. The differences become apparent with smaller IOU thresholds, IOU values closer to 1.0 should have a progressively smaller divergence approaching 0 when very close to 1.0.
Why did we do this? The difference results in performance improvements when dynamically assigning prediction true-positives depending on the selected IOU threshold.
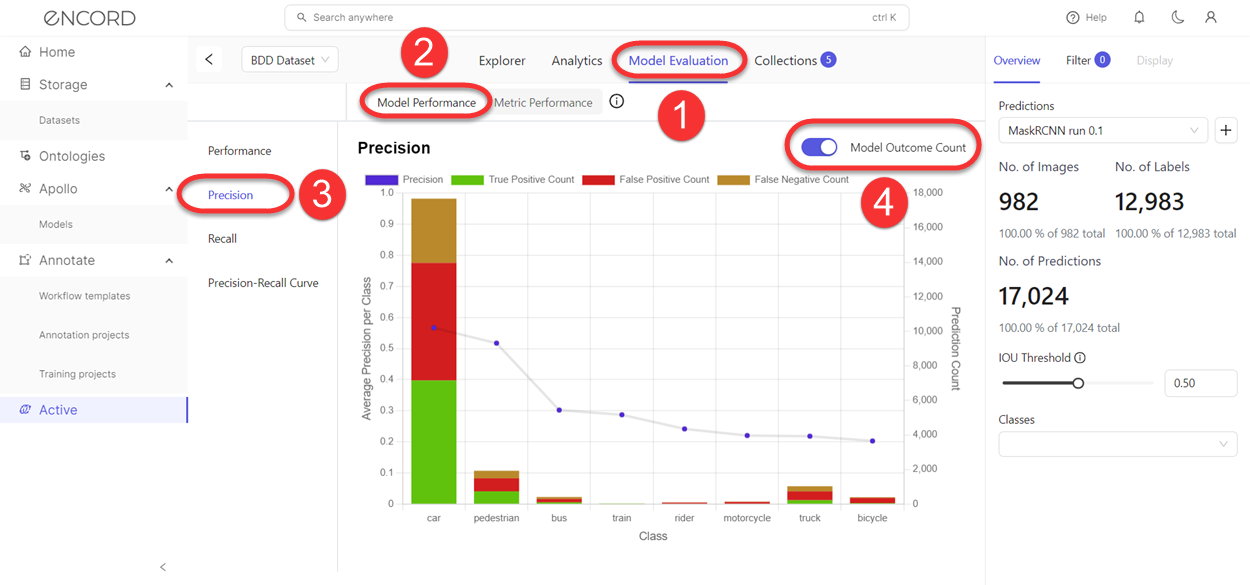
Model Performance
Model Performance - Performance

Model Performance - Precision
Model Perfomance - Recall

Model Perfomance - Precision-Recall Curve

Metric performance
Coming soon...
Next Steps
Model and Prediction Validation
Updated about 2 months ago